
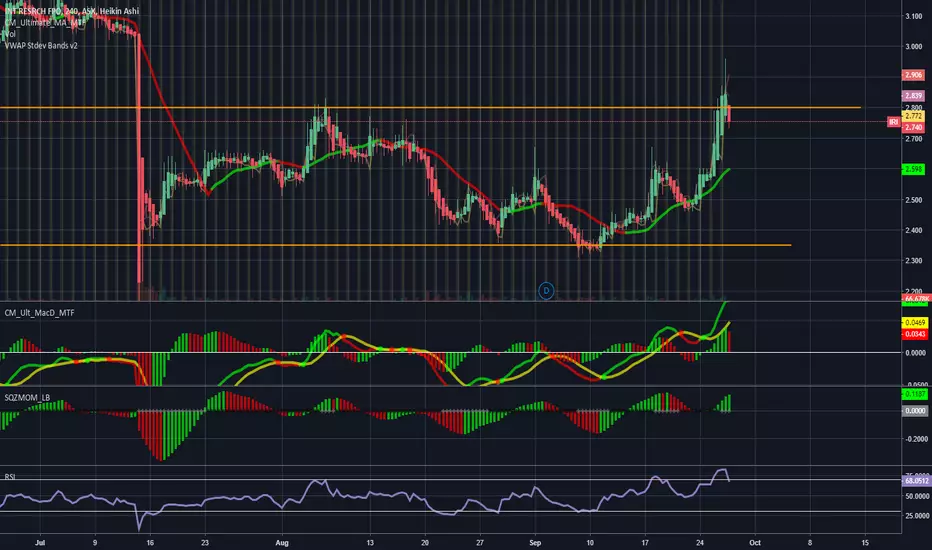
- Offers 15% potential between top and bottom drawn support and resistance
- If it makes higher highs past $3 then continue to be patient and wait for further higher highs and higher lows to confirm that it's on the uptrend before getting in for a swing trade
- On the weekly chart, IRI is in a down trend and is hitting the moving average line, so wait and see if it can bust through that or if it is just going to get rejected

免責聲明
這些資訊和出版物並非旨在提供,也不構成TradingView提供或認可的任何形式的財務、投資、交易或其他類型的建議或推薦。請閱讀使用條款以了解更多資訊。