
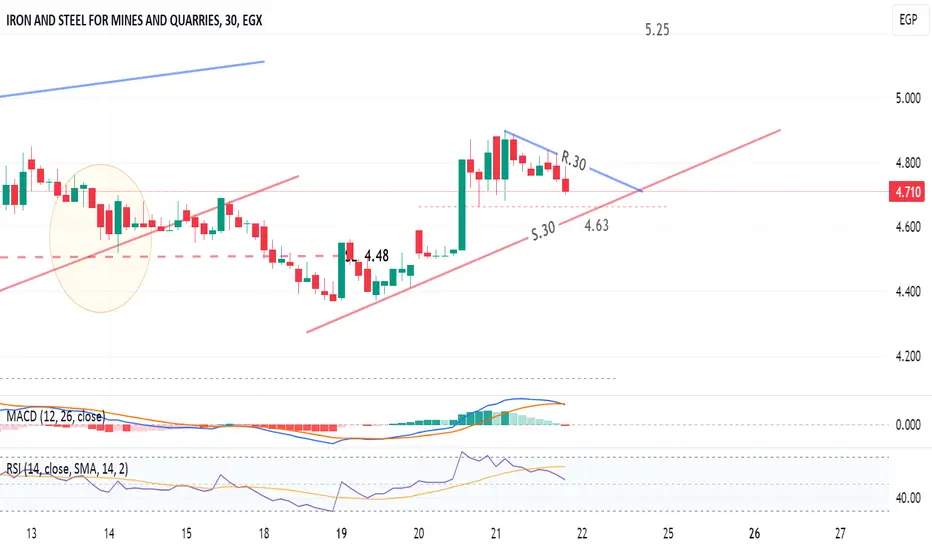
30-min chart, ISMQ is trading in a triangle, where the price is in the midway and the direction is downwards to the support line S.30
We should have a direction confirmation before a new buy entry.
Crossing above R.30, will push the price to 5.25
Stop loss below 4.60
We should have a direction confirmation before a new buy entry.
Crossing above R.30, will push the price to 5.25
Stop loss below 4.60

免責聲明
這些資訊和出版物並非旨在提供,也不構成TradingView提供或認可的任何形式的財務、投資、交易或其他類型的建議或推薦。請閱讀使用條款以了解更多資訊。