
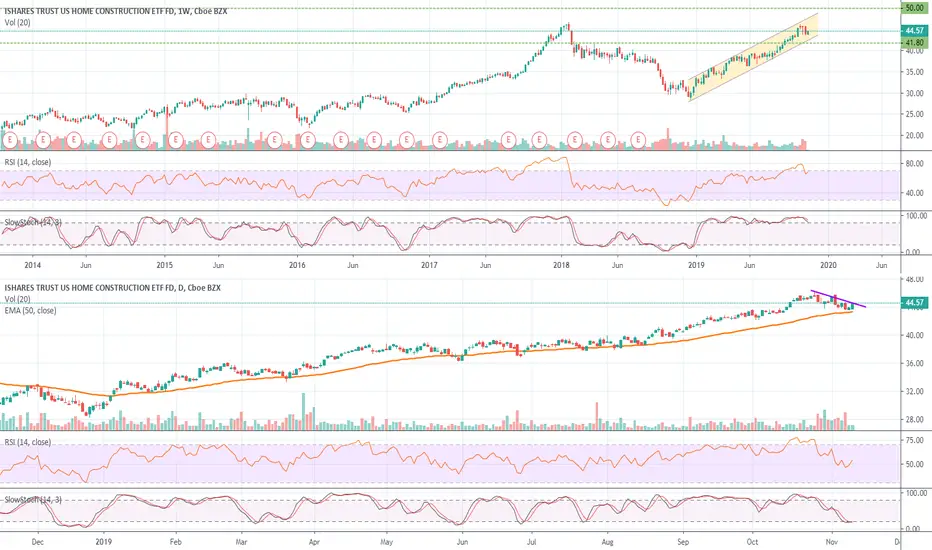
Here is a dual chart showing the weekly chart on top along with the daily chart below.
On the weekly chart, you can see how the price has remained within an ascending channel since the Christmas Eve low. The price recently hit and broke through the 61.8% Fibonacci Extension level in early September. The recent pullback has the price sitting right in-between the 61.8% & the 100% price levels.
Looking down at the daily chart, it seems like the price is getting ready to break out of a short pullback with the price finding support on the 50-day EMA line. The price is also exiting an oversold condition with the RSI still holding above 50. ITB looks to be getting ready for its next bullish swing higher.

免責聲明
這些資訊和出版物並非旨在提供,也不構成TradingView提供或認可的任何形式的財務、投資、交易或其他類型的建議或推薦。請閱讀使用條款以了解更多資訊。
免責聲明
這些資訊和出版物並非旨在提供,也不構成TradingView提供或認可的任何形式的財務、投資、交易或其他類型的建議或推薦。請閱讀使用條款以了解更多資訊。