
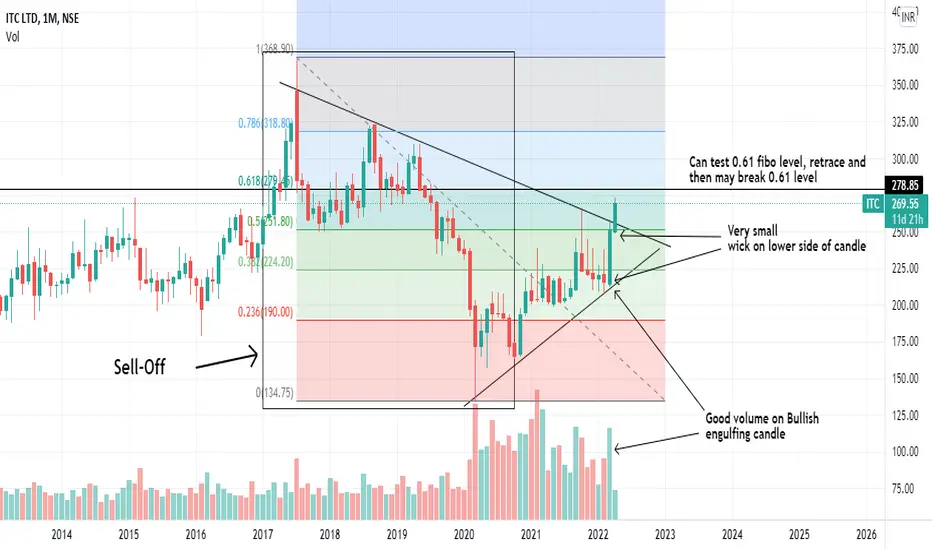
This is Monthly Timeframe.
Finally ITC is showing some strength, sell-off started in July 2017 and
it fell more than 60% from it's all time high and made a bottom in March 2020.
And after that it started a retracement, but the retracement have crossed the 0.50 fibo level,
and now approaching the 0.60 fibo level,
that means it not a retracement anymore. It may be a trend change.
Last month it have formed a thick bullish engulfing candle with good volume.
It is showing strength in this month too.
There is now high probability that it may test 0.60 level, retrace, and then break it.
And that will be a confirmation of a trend reversal.
This post is for information purpose only.

免責聲明
這些資訊和出版物並非旨在提供,也不構成TradingView提供或認可的任何形式的財務、投資、交易或其他類型的建議或推薦。請閱讀使用條款以了解更多資訊。
免責聲明
這些資訊和出版物並非旨在提供,也不構成TradingView提供或認可的任何形式的財務、投資、交易或其他類型的建議或推薦。請閱讀使用條款以了解更多資訊。