
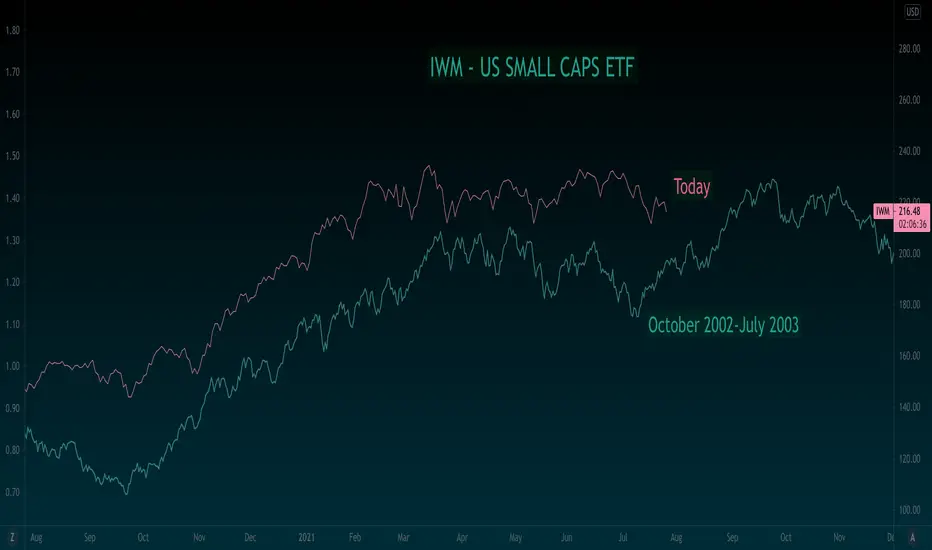
In this chart we analyze the relationship between the Small Cap iShares ETF and an analog of the 2002-2003 price action. From our view, we can see that we are clearly holding a similar pattern from back in the early part of that decade. This happened to be after a recession as well where the value/growth rotations were just as if not stronger than they are today. Something to keep in mind.
In short, we are bullish on the small cap sector from here. The risk reward is clear vs the recent range lows on the daily chart for a sustained move over the coming months higher.
In short, we are bullish on the small cap sector from here. The risk reward is clear vs the recent range lows on the daily chart for a sustained move over the coming months higher.

免責聲明
這些資訊和出版物並非旨在提供,也不構成TradingView提供或認可的任何形式的財務、投資、交易或其他類型的建議或推薦。請閱讀使用條款以了解更多資訊。
免責聲明
這些資訊和出版物並非旨在提供,也不構成TradingView提供或認可的任何形式的財務、投資、交易或其他類型的建議或推薦。請閱讀使用條款以了解更多資訊。