
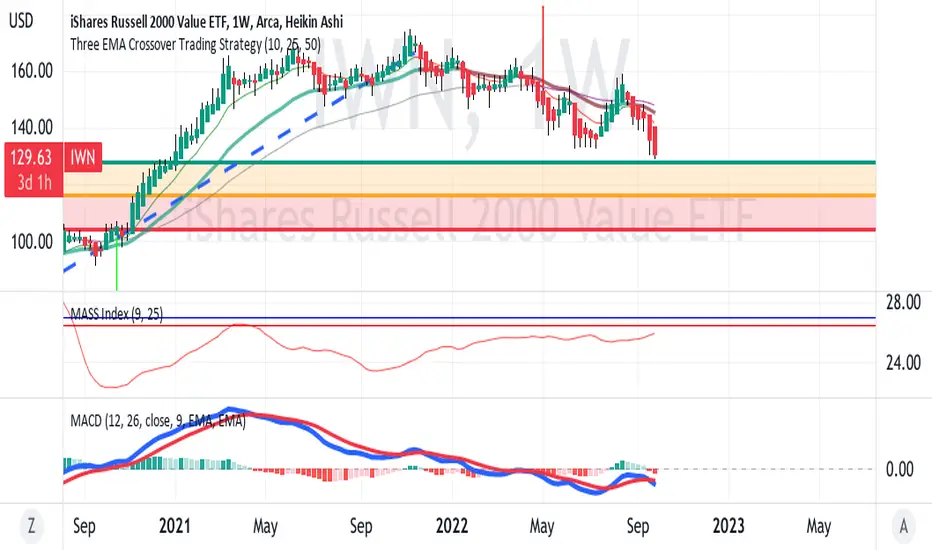
IWN as shown on the weekly chart has been obviously in a downtrend as also shown by
the EMA ribbon.
Using the uptrend from the Covid crash into November 2021 and then a retracement from that,
IWN is approchaing the 38.2 Fibonacci level at 128
From there it could bounce up or continue the downtrend.
The Mass Index being below 27 suggests a continuation before any potential reversal.
The MACD indicator shows the MACD in blue crossing down on the signal in red.
This also suggests more downtrend.
All in all, this analysis is bearish on the Russell index and its ETF.

免責聲明
這些資訊和出版物並非旨在提供,也不構成TradingView提供或認可的任何形式的財務、投資、交易或其他類型的建議或推薦。請閱讀使用條款以了解更多資訊。
免責聲明
這些資訊和出版物並非旨在提供,也不構成TradingView提供或認可的任何形式的財務、投資、交易或其他類型的建議或推薦。請閱讀使用條款以了解更多資訊。