
Good evening?
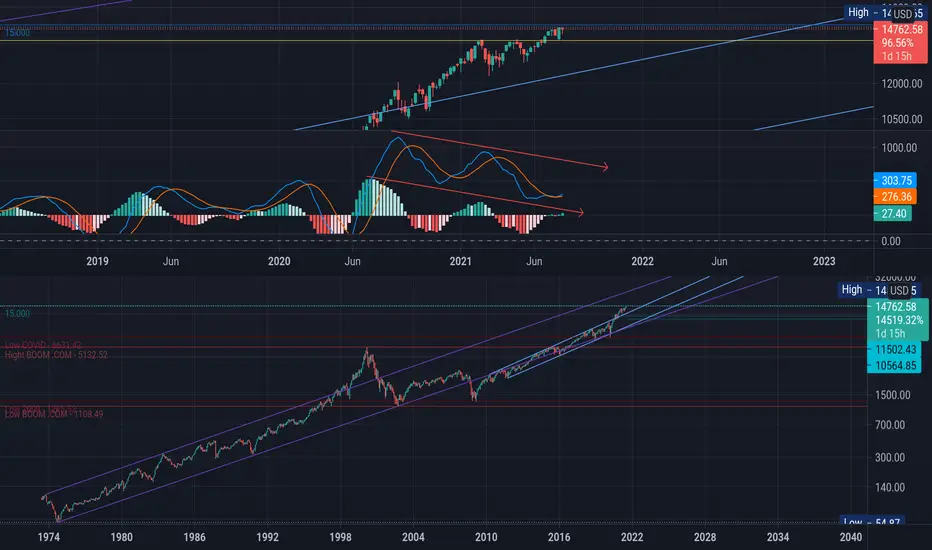
Signals to sell NASDAQ in general and BigTech shares in particular:
1. Round price of $ 15,000 = resistance.
2. Strong bearish MACD divergence on the weekly chart.
3. Beginning of bearish MACD divergence on slower monthly chart.
4. Bull trap - upward breakout of the resistance of the double top (yellow line).
Therefore, we can expect a Fibonacci correction from 30-50% to the $ 11.5k-10.5k range.
Not a financial recommendation.
GET RICH OR DIE TRYIN.
Signals to sell NASDAQ in general and BigTech shares in particular:
1. Round price of $ 15,000 = resistance.
2. Strong bearish MACD divergence on the weekly chart.
3. Beginning of bearish MACD divergence on slower monthly chart.
4. Bull trap - upward breakout of the resistance of the double top (yellow line).
Therefore, we can expect a Fibonacci correction from 30-50% to the $ 11.5k-10.5k range.
Not a financial recommendation.
GET RICH OR DIE TRYIN.

免責聲明
這些資訊和出版物並非旨在提供,也不構成TradingView提供或認可的任何形式的財務、投資、交易或其他類型的建議或推薦。請閱讀使用條款以了解更多資訊。
免責聲明
這些資訊和出版物並非旨在提供,也不構成TradingView提供或認可的任何形式的財務、投資、交易或其他類型的建議或推薦。請閱讀使用條款以了解更多資訊。