
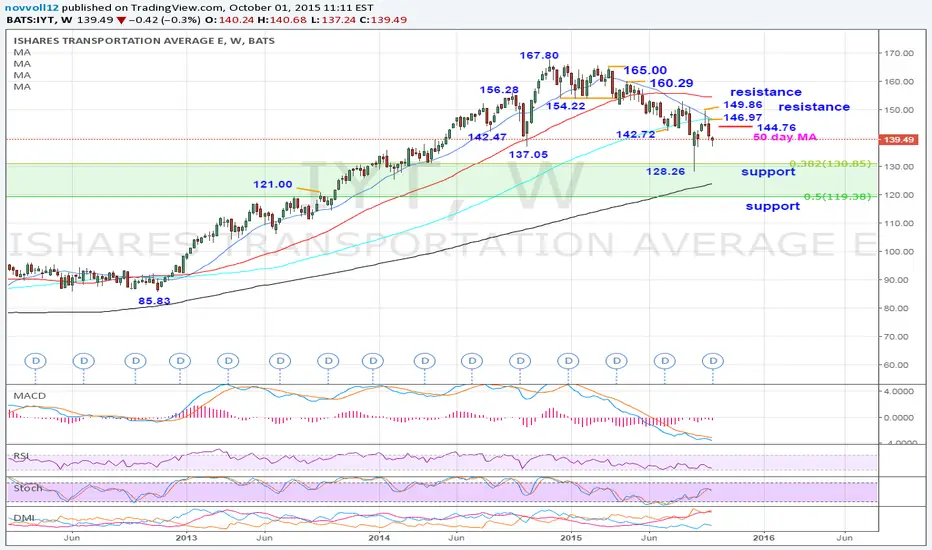
IYT 139.46 bearish – Potential to test August’s 128.26 low
IYT has been consolidating within the wide range between August’s 128.26 low (August 24, 2015) and the recovery high at 149.86 (September 14, 2015). Given the strong bearish momentum, there is potential to see a retest of the 128.26 low near 38.2% of the 70.82/167.80 (October 2011 low/November 2014 high) rise. Below lies the 200 week moving average currently at 123.69. The 142.72/146.97 resistance zone (July 6 low/September 21 high, 2015) which houses the 50 day moving average currently at 144.76 should cap bounces. Bulls must reclaim the area to stabilize the structure and improve the outlook for 149.86.
Outlook:
Daily: bearish
Weekly: neutral
IYT has been consolidating within the wide range between August’s 128.26 low (August 24, 2015) and the recovery high at 149.86 (September 14, 2015). Given the strong bearish momentum, there is potential to see a retest of the 128.26 low near 38.2% of the 70.82/167.80 (October 2011 low/November 2014 high) rise. Below lies the 200 week moving average currently at 123.69. The 142.72/146.97 resistance zone (July 6 low/September 21 high, 2015) which houses the 50 day moving average currently at 144.76 should cap bounces. Bulls must reclaim the area to stabilize the structure and improve the outlook for 149.86.
Outlook:
Daily: bearish
Weekly: neutral

免責聲明
這些資訊和出版物並非旨在提供,也不構成TradingView提供或認可的任何形式的財務、投資、交易或其他類型的建議或推薦。請閱讀使用條款以了解更多資訊。