
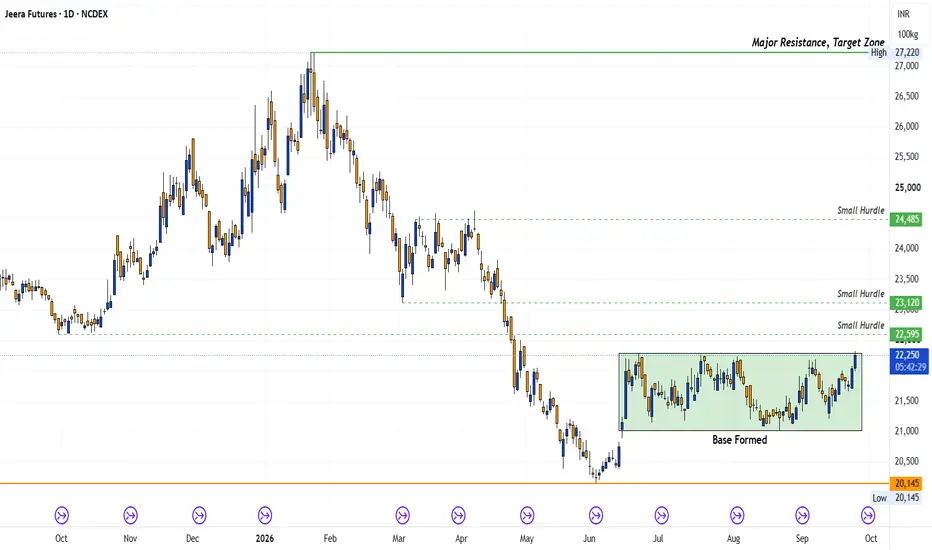
After a prolonged decline from the 27,220 zone, Jeera Futures has spent several months building a clear base between ~21,000 and 22,300.
Trade Idea: LONG — only after confirmation
Current price: 22,300 around
Key levels:
22,595 — First hurdle / breakout trigger
23,120 — Next resistance
24,485 — Major intermediate hurdle
27,220 — Major resistance / target zone
21,000 — Base support / structural invalidation
Possible Trade Plan
Entry: Above 22,595 after a convincing breakout
Stop Loss: Below the 21,000 base
Targets: 23,120 → 24,485 → 27,220
I would not chase the current price. The important event is the breakout of 22,595.
What this chart teaches :
A base after a long downtrend is interesting because it shows that selling pressure is no longer producing fresh lows.
But a base itself is not a buy signal.
The sequence to watch is:
Downtrend → Base formation → Resistance breakout → Retest → Continuation
The key mistake traders often make is buying somewhere inside the base simply because price looks "cheap."
Instead, identify:
Where buyers defended the market — ~21,000
Where sellers repeatedly appeared — ~22,595
Wait for price to prove that resistance has changed into support.
If 22,595 breaks and holds, the market can potentially move toward the next hurdles at 23,120 and 24,485, with 27,220 being the larger resistance zone shown on the chart.
The trade isn't the prediction.
The breakout + confirmation is the trade.
Trade Idea: LONG — only after confirmation
Current price: 22,300 around
Key levels:
22,595 — First hurdle / breakout trigger
23,120 — Next resistance
24,485 — Major intermediate hurdle
27,220 — Major resistance / target zone
21,000 — Base support / structural invalidation
Possible Trade Plan
Entry: Above 22,595 after a convincing breakout
Stop Loss: Below the 21,000 base
Targets: 23,120 → 24,485 → 27,220
I would not chase the current price. The important event is the breakout of 22,595.
What this chart teaches :
A base after a long downtrend is interesting because it shows that selling pressure is no longer producing fresh lows.
But a base itself is not a buy signal.
The sequence to watch is:
Downtrend → Base formation → Resistance breakout → Retest → Continuation
The key mistake traders often make is buying somewhere inside the base simply because price looks "cheap."
Instead, identify:
Where buyers defended the market — ~21,000
Where sellers repeatedly appeared — ~22,595
Wait for price to prove that resistance has changed into support.
If 22,595 breaks and holds, the market can potentially move toward the next hurdles at 23,120 and 24,485, with 27,220 being the larger resistance zone shown on the chart.
The trade isn't the prediction.
The breakout + confirmation is the trade.

免責聲明
這些資訊和出版物並非旨在提供,也不構成TradingView提供或認可的任何形式的財務、投資、交易或其他類型的建議或推薦。請閱讀使用條款以了解更多資訊。