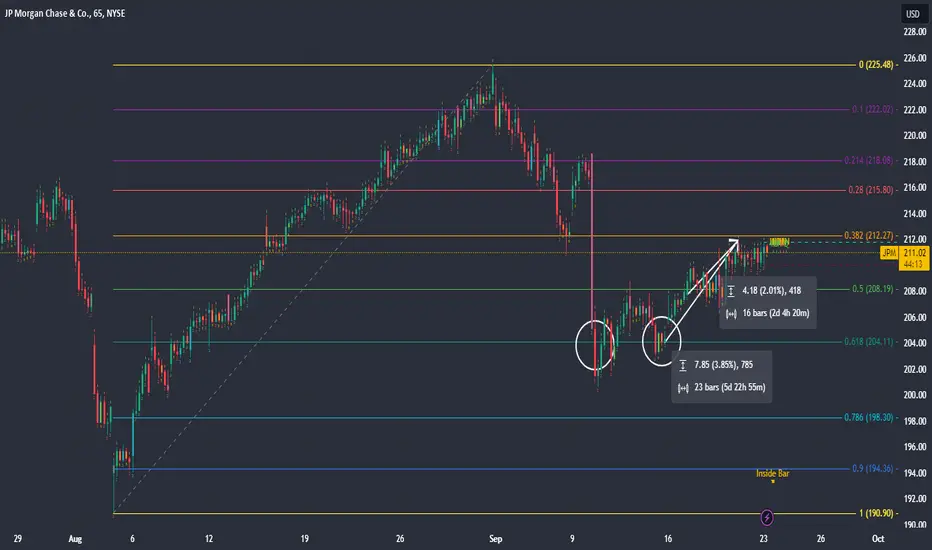
What's up everyone, I'm back with some quick update on $JPM.
Quick fact: The 65-minute chart has 6 evenly sized candles (65 x 6 = 390, amt of mins per day).
Based on our previous analysis:
- JPM has bounced off the 0.618 bullish Fibonacci on the 65-minute chart at $204.11
- Price Target of $225.48 at 0.0 (assuming we continue the bullish trend)
- Stop Loss of $194.36 at the 0.9 bullish Fibonacci
The price is currently up 2% from when we first analyzed the stock and 3.85% from the last time it touched 0.618.
If you're in the play, stay the course, move your stop loss to 0.5 Fibonacci if you want to decrease your risk. If not, hold on.
I'm not in the play.
Quick fact: The 65-minute chart has 6 evenly sized candles (65 x 6 = 390, amt of mins per day).
Based on our previous analysis:
-
JPM has bounced off the 0.618 bullish Fibonacci on the 65-minute chart at $204.11- Price Target of $225.48 at 0.0 (assuming we continue the bullish trend)
- Stop Loss of $194.36 at the 0.9 bullish Fibonacci
The price is currently up 2% from when we first analyzed the stock and 3.85% from the last time it touched 0.618.
If you're in the play, stay the course, move your stop loss to 0.5 Fibonacci if you want to decrease your risk. If not, hold on.
I'm not in the play.

免責聲明
這些資訊和出版物並非旨在提供,也不構成TradingView提供或認可的任何形式的財務、投資、交易或其他類型的建議或推薦。請閱讀使用條款以了解更多資訊。