

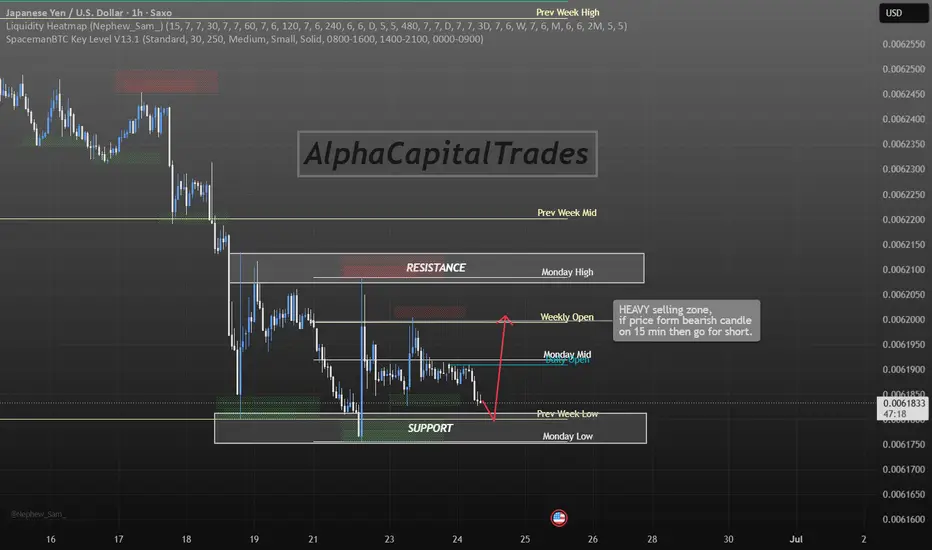
JPYUSD is playing out a clean bearish structure on the 1H chart. After a sharp drop from the 0.006250+ highs on June 17–18, price has been grinding lower, creating consistent lower highs. Currently price has bounced into the Weekly Open / Heavy Selling Zone around 0.006195–0.006205, which aligns with the Monday Mid level — making this a high-confluence rejection area.
📊 Structure Breakdown:
Price broke down hard from the 0.006240–0.006250 supply cluster (Monday High + Resistance Zone) — multiple failed attempts to reclaim it confirm bearish control
The bounce from the Prev Week Low / Monday Low Support zone (~0.006180) was expected — price swept that low and is now retracing into the sell zone
Weekly Open at ~0.006200 is acting as a magnet for price — this is where Smart Money is defending with heavy sell orders
The annotation on the chart is precise: if price prints a bearish candle on 15M at this zone, it's a short trigger
🧠 Two Scenarios:
Scenario A — Bearish Continuation (Primary Bias):
Rejection from 0.006195–0.006205 (Weekly Open zone) with a 15M bearish confirmation → short toward 0.006180 → 0.006160 Support (Prev Week Low / Monday Low zone).
Scenario B — Bullish Breakout:
If price closes above 0.006210 (Monday High / Resistance) on the 1H with volume, the bearish setup is invalidated and price could push toward 0.006225–0.006250.
📌 Macro Context:
The Japanese Yen is hovering near its weakest levels since 1986 at around 161.5 per dollar, as repeated verbal intervention from Tokyo has failed to halt the currency's decline — even after the BOJ hiked rates by 25bps to 1.0% last week. The Yen remains under pressure from heavy carry-trade activity as investors continue to favour short Yen positions amid the still-wide interest rate gap between Japan and the US. This macro backdrop keeps JPYUSD (Yen) structurally weak — every bounce is a sell opportunity until the rate differential meaningfully narrows. TRADING ECONOMICSTRADING ECONOMICS
⚠️ Key Levels:
ZonePriceResistance (Active)0.006210 – 0.006215Heavy Sell Zone / Weekly Open0.006195 – 0.006205Monday Mid0.006193Prev Week Low / Support0.006180Monday Low / Deep Support0.006175
Not financial advice. Always manage your risk. Follow AlphaCapitalTrades for daily SMC-based analysis.
📊 Structure Breakdown:
Price broke down hard from the 0.006240–0.006250 supply cluster (Monday High + Resistance Zone) — multiple failed attempts to reclaim it confirm bearish control
The bounce from the Prev Week Low / Monday Low Support zone (~0.006180) was expected — price swept that low and is now retracing into the sell zone
Weekly Open at ~0.006200 is acting as a magnet for price — this is where Smart Money is defending with heavy sell orders
The annotation on the chart is precise: if price prints a bearish candle on 15M at this zone, it's a short trigger
🧠 Two Scenarios:
Scenario A — Bearish Continuation (Primary Bias):
Rejection from 0.006195–0.006205 (Weekly Open zone) with a 15M bearish confirmation → short toward 0.006180 → 0.006160 Support (Prev Week Low / Monday Low zone).
Scenario B — Bullish Breakout:
If price closes above 0.006210 (Monday High / Resistance) on the 1H with volume, the bearish setup is invalidated and price could push toward 0.006225–0.006250.
📌 Macro Context:
The Japanese Yen is hovering near its weakest levels since 1986 at around 161.5 per dollar, as repeated verbal intervention from Tokyo has failed to halt the currency's decline — even after the BOJ hiked rates by 25bps to 1.0% last week. The Yen remains under pressure from heavy carry-trade activity as investors continue to favour short Yen positions amid the still-wide interest rate gap between Japan and the US. This macro backdrop keeps JPYUSD (Yen) structurally weak — every bounce is a sell opportunity until the rate differential meaningfully narrows. TRADING ECONOMICSTRADING ECONOMICS
⚠️ Key Levels:
ZonePriceResistance (Active)0.006210 – 0.006215Heavy Sell Zone / Weekly Open0.006195 – 0.006205Monday Mid0.006193Prev Week Low / Support0.006180Monday Low / Deep Support0.006175
Not financial advice. Always manage your risk. Follow AlphaCapitalTrades for daily SMC-based analysis.

免責聲明
這些資訊和出版物並非旨在提供,也不構成TradingView提供或認可的任何形式的財務、投資、交易或其他類型的建議或推薦。請閱讀使用條款以了解更多資訊。
免責聲明
這些資訊和出版物並非旨在提供,也不構成TradingView提供或認可的任何形式的財務、投資、交易或其他類型的建議或推薦。請閱讀使用條款以了解更多資訊。