
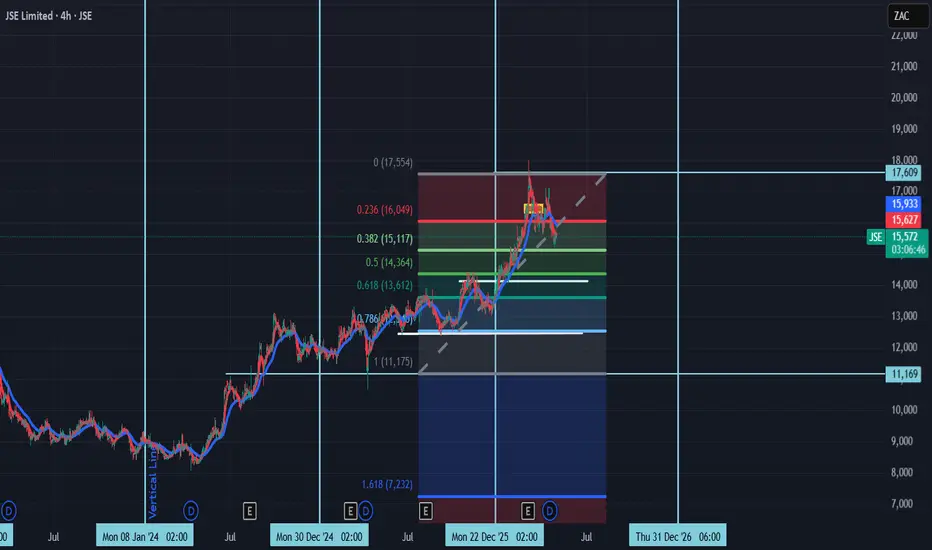
1. Technical Outlook: The 14,191 Pivot on the 4-hour chart, the price is currently hovering around 15,611 after a period of sustained growth.
The Correction Target: The white line identified at near Fib zone of (0.50) 14,191 represents a critical structural level—the previous higher high that often acts as a landing zone during a retracement.
Downside Risk: If price fails to find support at 14,191, the next significant floor sits near the 12,500 region, which aligns with previous consolidation zones from late 2025.
2. Fundamental Expansion: Balance Sheet Growth
Asset vs. Liability Growth: As of December 2025, Total Assets grew by 21.32% to reach 67.54B, while Total Liabilities increased by a slightly higher 22.53% to 62.48B.
Net Debt: The net debt position moved from -2.50B in 2024 to -2.99B in 2025. While this indicates a strong cash-to-debt ratio (net cash), the sheer scale of the balance sheet expansion during a high-interest-rate environment can lead to valuation sensitivity.
Industry Headwinds: The broader South African Financials industry has already begun to cool, dropping 1.8% in the final week of April 2026.
The Correction Target: The white line identified at near Fib zone of (0.50) 14,191 represents a critical structural level—the previous higher high that often acts as a landing zone during a retracement.
Downside Risk: If price fails to find support at 14,191, the next significant floor sits near the 12,500 region, which aligns with previous consolidation zones from late 2025.
2. Fundamental Expansion: Balance Sheet Growth
Asset vs. Liability Growth: As of December 2025, Total Assets grew by 21.32% to reach 67.54B, while Total Liabilities increased by a slightly higher 22.53% to 62.48B.
Net Debt: The net debt position moved from -2.50B in 2024 to -2.99B in 2025. While this indicates a strong cash-to-debt ratio (net cash), the sheer scale of the balance sheet expansion during a high-interest-rate environment can lead to valuation sensitivity.
Industry Headwinds: The broader South African Financials industry has already begun to cool, dropping 1.8% in the final week of April 2026.

免責聲明
這些資訊和出版物並非旨在提供,也不構成TradingView提供或認可的任何形式的財務、投資、交易或其他類型的建議或推薦。請閱讀使用條款以了解更多資訊。
免責聲明
這些資訊和出版物並非旨在提供,也不構成TradingView提供或認可的任何形式的財務、投資、交易或其他類型的建議或推薦。請閱讀使用條款以了解更多資訊。