
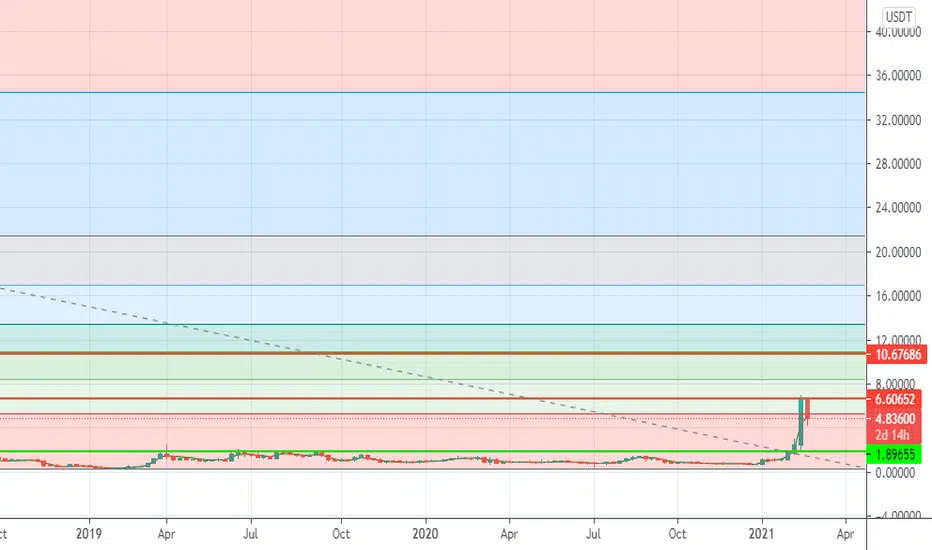
KCS broke a good support of $1.89 on the weekly graph in the first week of August 2018 and ever since it was struggling to break this support turned to resistance. It made various attempts to break this resistance in April, June, July, September and November 2019 but got rejected every time. Finally, in February, it broke this resistance of $1.89 and quickly jumped by over 300% in a week into the resistance of $6.60. If this resistance at $6.06 can be broken, we could start seeing a move towards the next fib and coinciding resistance at $10.88. Breaking this resistance could lead to a move towards the higher fibs at $13.37, $16.91, $21.43 and $34.47.

免責聲明
這些資訊和出版物並非旨在提供,也不構成TradingView提供或認可的任何形式的財務、投資、交易或其他類型的建議或推薦。請閱讀使用條款以了解更多資訊。
免責聲明
這些資訊和出版物並非旨在提供,也不構成TradingView提供或認可的任何形式的財務、投資、交易或其他類型的建議或推薦。請閱讀使用條款以了解更多資訊。