
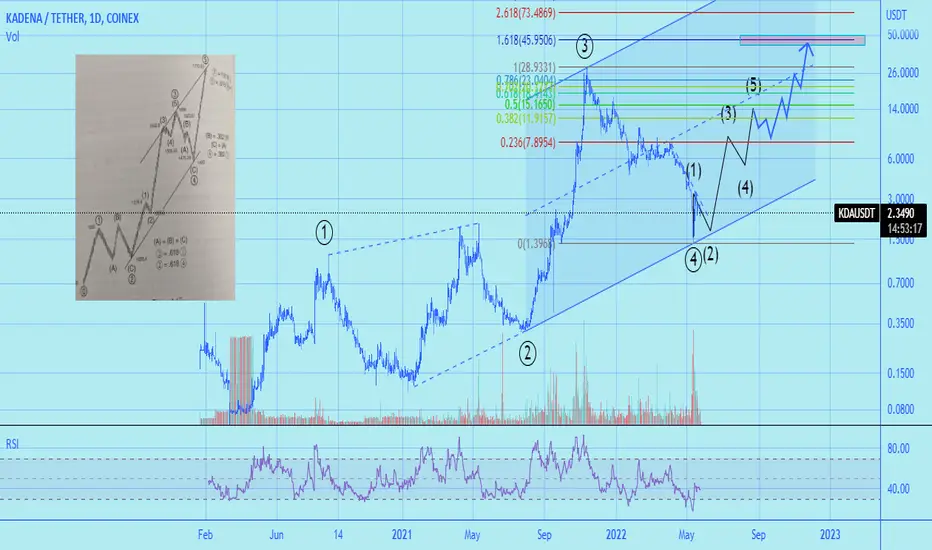
So I've been casually browsing the book "Elliott wave principle" by A.J. Frost (a must have, btw) and came across this sample.
Remarkable how similar these two charts are (hope you see it the pic due to me being on a laptop). It's quite striking that the 5th wave isn't done yet. So if this is to be true, profit-taking target, according to the book, is at 1.618 Fib or ~$45.
Wave 2 - flat; Wave 4 - zigzag -> meaning EW alternation is valid.
Current situation and plan
interpretation of current structure is a possibility of us being in the 2nd wave of the first wave in this last leg up. Expecting more downside and hit of the lower channel line. If not, cool.
註釋
Adam and Eve bottom forming? Watch out for a potential rounded bottom now i.e. Eve.
免責聲明
這些資訊和出版物並非旨在提供,也不構成TradingView提供或認可的任何形式的財務、投資、交易或其他類型的建議或推薦。請閱讀使用條款以了解更多資訊。