已更新
Upcoming action?
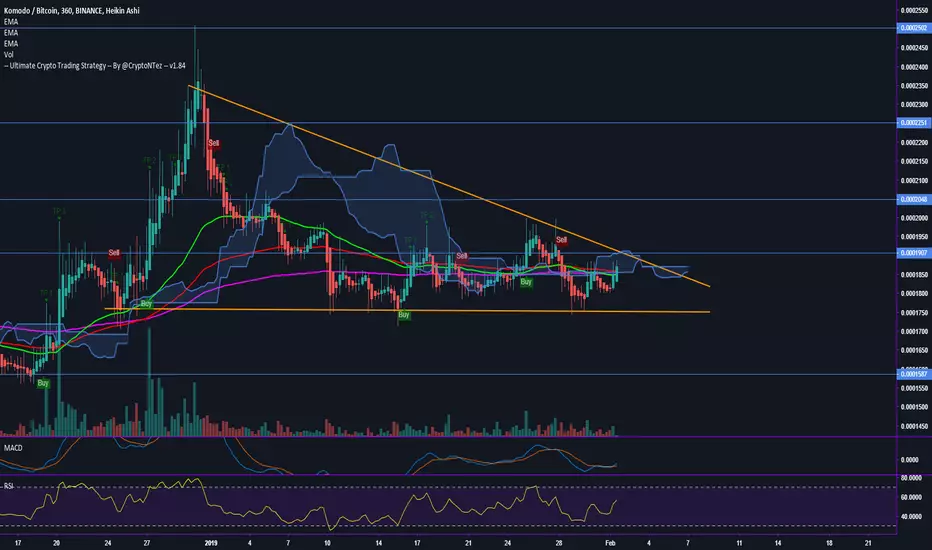
We may see some action in the following days Currently showing a structure that looks like a descending triangle but upcoming events turn me to think that this will break to the upside.
MACD bullcross and RSI rising, EMA50-100-200 almost all together #KMD
Targets both to the upside and downside are on the chart. The alert from the UCTS bring me to this chart since a buy signal is flashing time to time, that is one way that the tool can help you to filter noise from markets and check only that charts where something is happening
MACD bullcross and RSI rising, EMA50-100-200 almost all together #KMD
Targets both to the upside and downside are on the chart. The alert from the UCTS bring me to this chart since a buy signal is flashing time to time, that is one way that the tool can help you to filter noise from markets and check only that charts where something is happening
手動結束交易
Update on  KMD, All targets met. I will close my position here. Hope you got the 30%+ profit too!. #KMD Happy trading!

免責聲明
這些資訊和出版物並非旨在提供,也不構成TradingView提供或認可的任何形式的財務、投資、交易或其他類型的建議或推薦。請閱讀使用條款以了解更多資訊。
免責聲明
這些資訊和出版物並非旨在提供,也不構成TradingView提供或認可的任何形式的財務、投資、交易或其他類型的建議或推薦。請閱讀使用條款以了解更多資訊。