
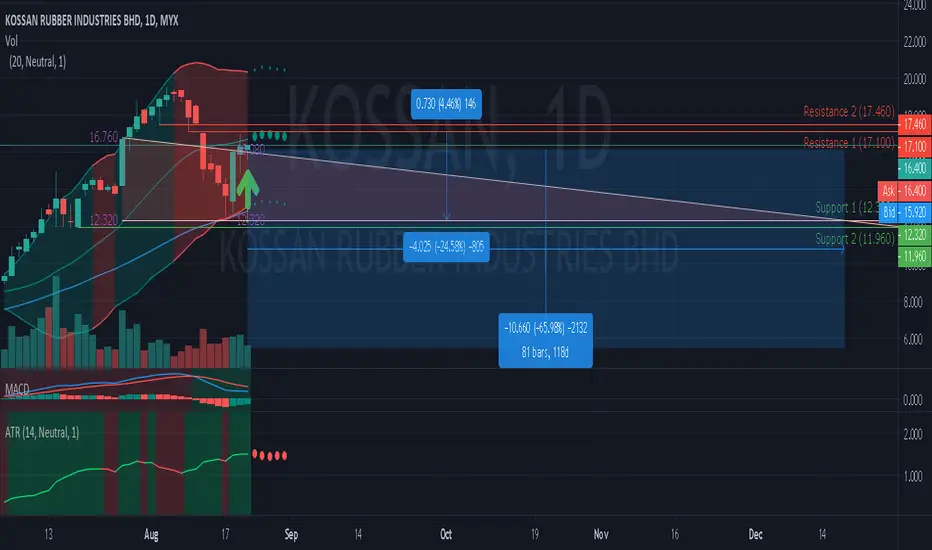
The support and resistance level of Kossan are 12.32 and 17.1 respectively.
It is observed that the MACD line of KOSSAN is above the centreline indicating some degree of strength in the price movement.
Resistance 1 : 17.1 (4.46%)
Resistance 2 : 17.46
Support 1 : 12.32 (-24.58%)
Support 2 : 11.96
Descending Triangle prediction at 21 Aug 2020.
Possible bearish price movement towards the resistance 12.32 within the next 118 days (81 bars : ETA 16 Dec 2020).
It is observed that the MACD line of KOSSAN is above the centreline indicating some degree of strength in the price movement.
Resistance 1 : 17.1 (4.46%)
Resistance 2 : 17.46
Support 1 : 12.32 (-24.58%)
Support 2 : 11.96
Descending Triangle prediction at 21 Aug 2020.
Possible bearish price movement towards the resistance 12.32 within the next 118 days (81 bars : ETA 16 Dec 2020).

免責聲明
這些資訊和出版物並非旨在提供,也不構成TradingView提供或認可的任何形式的財務、投資、交易或其他類型的建議或推薦。請閱讀使用條款以了解更多資訊。
免責聲明
這些資訊和出版物並非旨在提供,也不構成TradingView提供或認可的任何形式的財務、投資、交易或其他類型的建議或推薦。請閱讀使用條款以了解更多資訊。