做多
Keep3rV1 KP3R
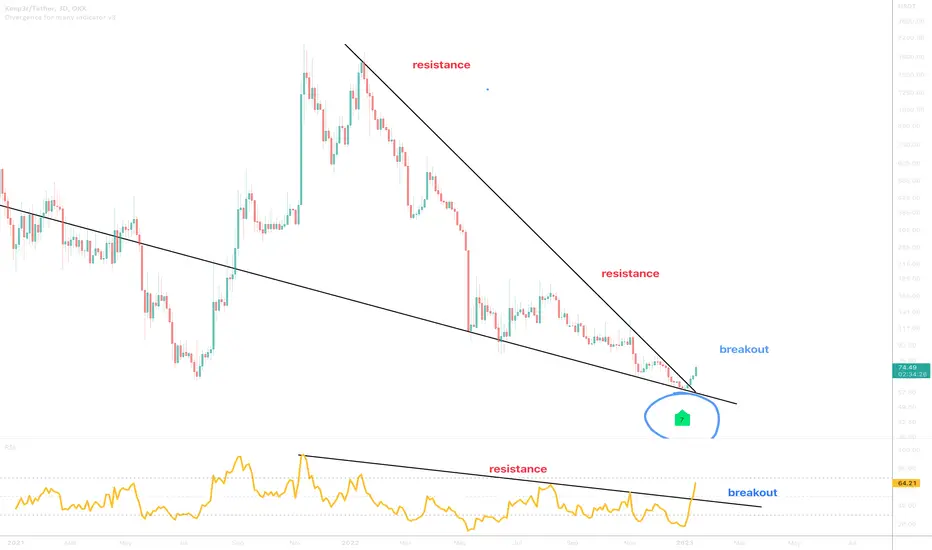
On the above 3-day chart price action has corrected 96% since the sell signal (not shown) @ $1500. Now is an excellent moment to be long. Why?
1) A strong buy signal prints (not shown).
2) The strong signal also prints on the BTC pair.
3) Regular bullish divergence . Lots of it. This divergence is measured over 40 days.
4) Price action and RSI resistance breakouts.
5) Nudge nudge wink wink.
Is it possible price action falls further? Sure.
Is it probable? No
Ww
Type: trade
Risk: <=6% of portfolio
Timeframe: Don’t know.
Return: Don’t know
1) A strong buy signal prints (not shown).
2) The strong signal also prints on the BTC pair.
3) Regular bullish divergence . Lots of it. This divergence is measured over 40 days.
4) Price action and RSI resistance breakouts.
5) Nudge nudge wink wink.
Is it possible price action falls further? Sure.
Is it probable? No
Ww
Type: trade
Risk: <=6% of portfolio
Timeframe: Don’t know.
Return: Don’t know
交易進行
註釋
$12k per token? Is it possible. Maybe - see below.註釋
Not since August 13th 2021 has this happened. Look left to see what happens next.4-day
註釋
A nudge and wink..交易進行
註釋
past resistance confirms support
免責聲明
這些資訊和出版物並非旨在提供,也不構成TradingView提供或認可的任何形式的財務、投資、交易或其他類型的建議或推薦。請閱讀使用條款以了解更多資訊。