
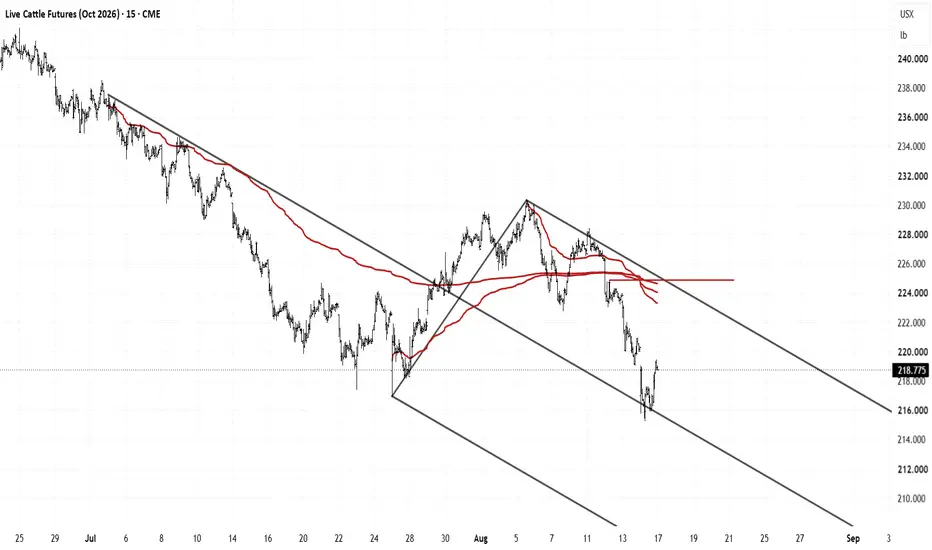
I have no idea what the weekly or daily chart is doing, the plan here is for there to be a pullback toward the upper parallel to sell the 5m chart, the interval in which the signal was generated:

The stop will be according to the volatility of the moment, ideally within the permitted parameters ($150-$300) by the Equivalent Risk between trades.
The objective is naturally the Center Line, but the risk/reward is so high that surely it will also be possible to plan for something closer.
The 3 curves plotted are what is typically called "Anchored VWAP", but that is a name they gave it later. The original idea comes from MIT physicist Paul Levine, and what they calculate is the approximate price at which distribution will enter the market when the market price coincides with the average selling price that the participants already have. When this convergence occurs, the optimal price to acquire more inventory is given. Generally, this coincides with the parallels of a set of Median Lines.
There is no magic line, secret entity or stories about anyone. There are buyers and sellers with an accounting matrix whose relationships are completely determined by basic arithmetic, so if they are willing to continue selling, the market may offer them prices that do not increase the cost of their inventory, diminish their profit or increase their risk, and if they take action, I'm going to be there when probabilities shift in my favor.
The stop will be according to the volatility of the moment, ideally within the permitted parameters ($150-$300) by the Equivalent Risk between trades.
The objective is naturally the Center Line, but the risk/reward is so high that surely it will also be possible to plan for something closer.
The 3 curves plotted are what is typically called "Anchored VWAP", but that is a name they gave it later. The original idea comes from MIT physicist Paul Levine, and what they calculate is the approximate price at which distribution will enter the market when the market price coincides with the average selling price that the participants already have. When this convergence occurs, the optimal price to acquire more inventory is given. Generally, this coincides with the parallels of a set of Median Lines.
There is no magic line, secret entity or stories about anyone. There are buyers and sellers with an accounting matrix whose relationships are completely determined by basic arithmetic, so if they are willing to continue selling, the market may offer them prices that do not increase the cost of their inventory, diminish their profit or increase their risk, and if they take action, I'm going to be there when probabilities shift in my favor.
交易進行
getting lucky here but can the trade build me a stop?
取消訂單
Price fell short by 1 tick of reaching the line.The short was here, using a tactic called "trading within your stop" and not waiting for the test and retest, just going short using market structure and convergence with the upper parallel.
Trading within your stop is a tactic we use to trade inside the boundaries of the median line set.
1. First, define the stop. The stop was defined as 30 ticks for this market.
2. Put the stop above a previous high.
3. Go short at the area where you want to go short without waiting for price to trade to the line.
Another example:
Another one:
The result: a higher probability of getting filled.

免責聲明
這些資訊和出版物並非旨在提供,也不構成TradingView提供或認可的任何形式的財務、投資、交易或其他類型的建議或推薦。請閱讀使用條款以了解更多資訊。
免責聲明
這些資訊和出版物並非旨在提供,也不構成TradingView提供或認可的任何形式的財務、投資、交易或其他類型的建議或推薦。請閱讀使用條款以了解更多資訊。