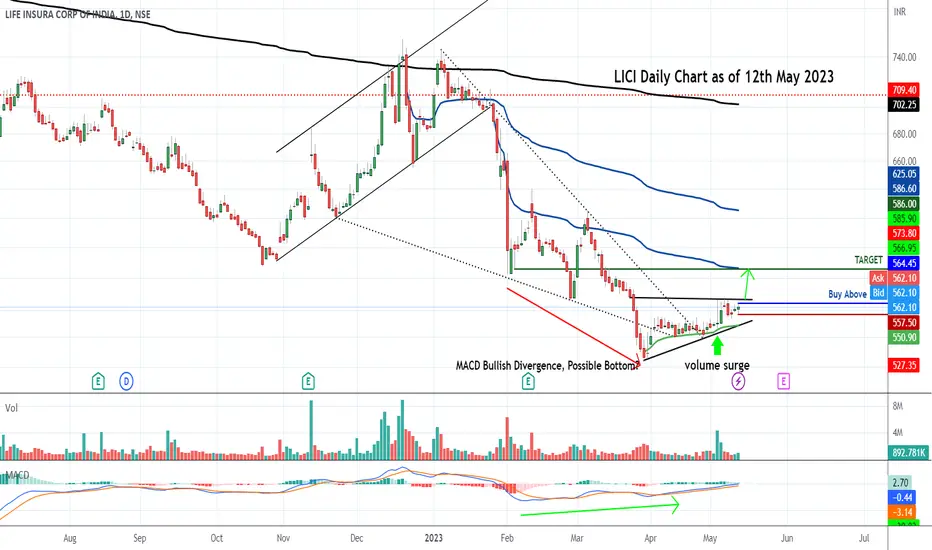
Attached:  LICI Daily Chart as of 12th May 2023
Buy Above 565which is PDH
Stop Loss below 555
For Targets:
T1= 585
T2= 600 +
Bullish Signals:
- MACD RSI Bullish Divergence
- Accumulation Pattern with Dried Up Volume
- Volume Surge started from 4th May
- Price above 20 DSMA
LICI Daily Chart as of 12th May 2023Buy Above 565which is PDH
Stop Loss below 555
For Targets:
T1= 585
T2= 600 +
Bullish Signals:
- MACD RSI Bullish Divergence
- Accumulation Pattern with Dried Up Volume
- Volume Surge started from 4th May
- Price above 20 DSMA
交易結束:目標達成
All Targets Met and even Exceeded !
Siddharth Bhansali
✔️Twitter Handle @T_Harth
✔️Twitter Handle @T_Harth
相關出版品
免責聲明
這些資訊和出版物並非旨在提供,也不構成TradingView提供或認可的任何形式的財務、投資、交易或其他類型的建議或推薦。請閱讀使用條款以了解更多資訊。
Siddharth Bhansali
✔️Twitter Handle @T_Harth
✔️Twitter Handle @T_Harth
相關出版品
免責聲明
這些資訊和出版物並非旨在提供,也不構成TradingView提供或認可的任何形式的財務、投資、交易或其他類型的建議或推薦。請閱讀使用條款以了解更多資訊。