
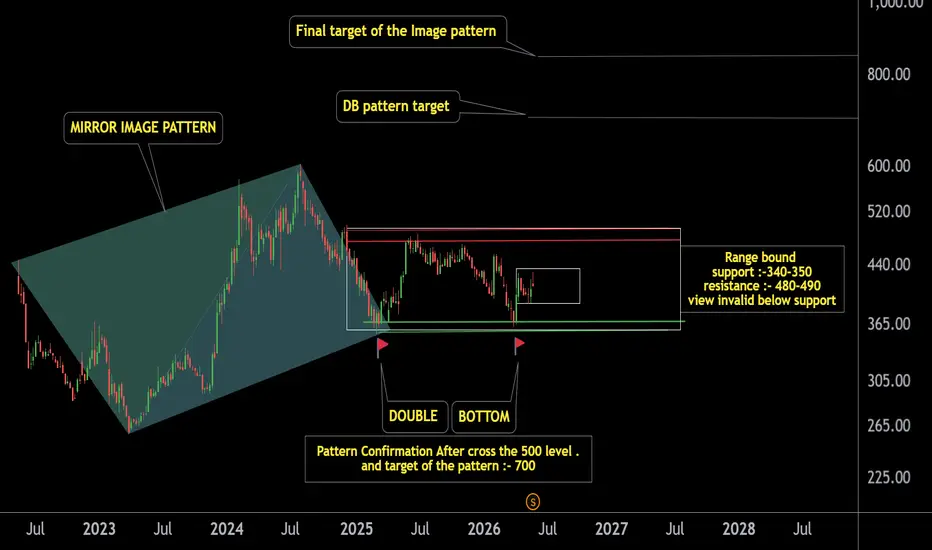
The stock has formed a strong Mirror Image Pattern along with a Double Bottom formation, indicating a potential trend reversal after a prolonged correction phase.
The support zone around 340–350 has been tested multiple times and has shown strong buying interest, strengthening the bullish structure.
A sustained move above the key resistance zone of 480–500 would confirm the pattern and could trigger a significant upside move towards 700 and higher levels.
Bullish view remains intact as long as the support zone holds.
View invalid below the support zone.
Thank You !!

@RahulSarawagi
Connect us at optionlab.co.in/
Connect us at optionlab.co.in/
免責聲明
這些資訊和出版物並非旨在提供,也不構成TradingView提供或認可的任何形式的財務、投資、交易或其他類型的建議或推薦。請閱讀使用條款以了解更多資訊。
@RahulSarawagi
Connect us at optionlab.co.in/
Connect us at optionlab.co.in/
免責聲明
這些資訊和出版物並非旨在提供,也不構成TradingView提供或認可的任何形式的財務、投資、交易或其他類型的建議或推薦。請閱讀使用條款以了解更多資訊。