
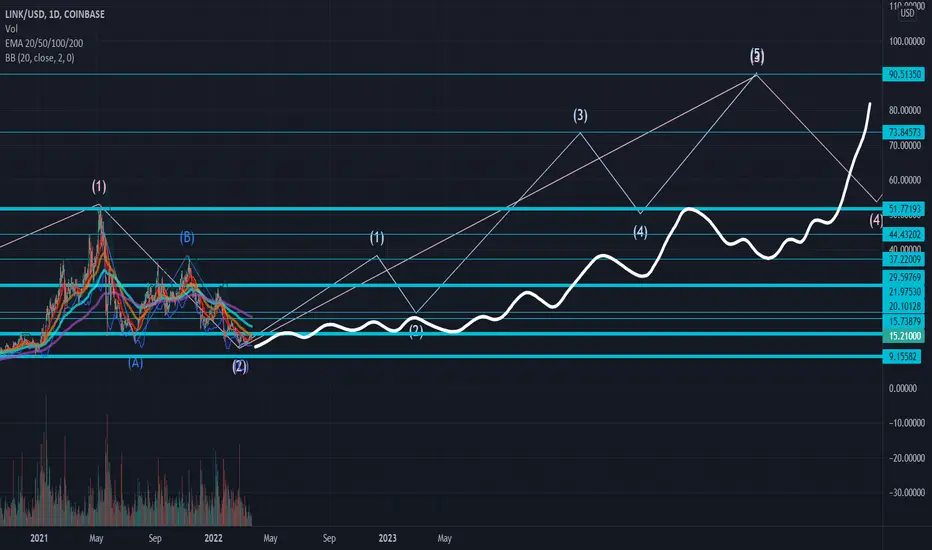
Testing/tracking elliot wave theory. Please do not trade off idea without S/L. Not financial advice.
Link to previous chart:

If you press play on the previous chart, you can see that we went lower and a new impulse trend did not start. We were still correcting and finishing up the C wave with the false breakout on the B. On the current chart we've either found the bottom or have one more leg down. The support and resistance lines are mapped out and the thicker lines mean there's either heavy resistance or support there. Currently we're having trouble getting above this resistance line, the EMA's are starting to curl up though, if we can manage to stay above it then I believe the next impulse wave can start for the bigger wave (3) cycle. This area is key levels for accumulation zone so no idea how long we will stay here. The white squiggly line is the line we'd all hate to see lol. Either way, price targets should be reached, just a longer route to it.
Link to previous chart:
If you press play on the previous chart, you can see that we went lower and a new impulse trend did not start. We were still correcting and finishing up the C wave with the false breakout on the B. On the current chart we've either found the bottom or have one more leg down. The support and resistance lines are mapped out and the thicker lines mean there's either heavy resistance or support there. Currently we're having trouble getting above this resistance line, the EMA's are starting to curl up though, if we can manage to stay above it then I believe the next impulse wave can start for the bigger wave (3) cycle. This area is key levels for accumulation zone so no idea how long we will stay here. The white squiggly line is the line we'd all hate to see lol. Either way, price targets should be reached, just a longer route to it.

免責聲明
這些資訊和出版物並非旨在提供,也不構成TradingView提供或認可的任何形式的財務、投資、交易或其他類型的建議或推薦。請閱讀使用條款以了解更多資訊。