
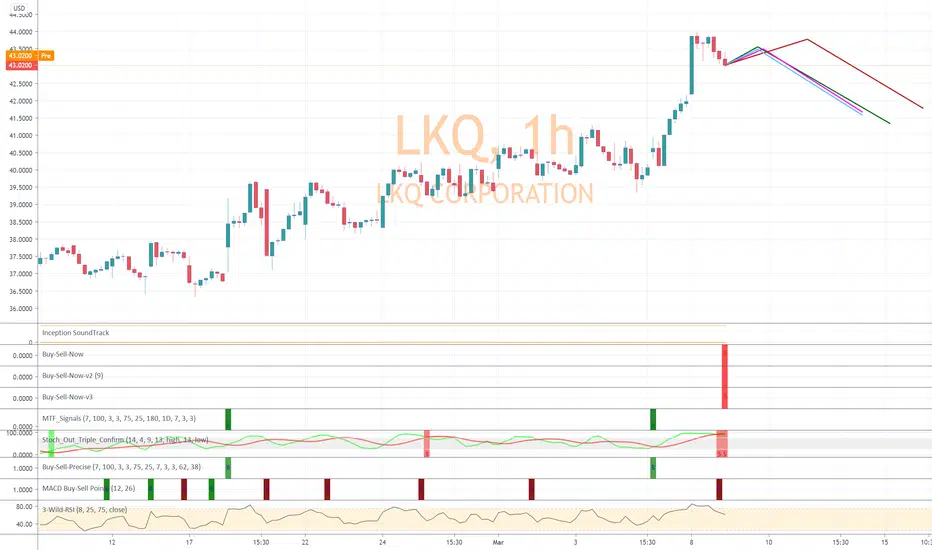
Five of our algorithms point to near-term declines for LKQ on the hourly chart. Our first algorithm (version 1) has identified this event 23 times. All 23 times the stock has dropped at least 1% over the next few days. It has dropped as much as 3% more than half the time. We are projecting slight movement up which should last no more than 2 full trading days before the decline could start. This is based on historical action of this stock when all 5 algorithms are signaled.

All forecasts are based on analysis of past behavior. Prior movements are not always indicative of future movement. Develop the theory, test the theory. Do your own research. Nothing in this analysis constitutes advice. YouTube For More. Good luck!!
相關出版品
免責聲明
這些資訊和出版物並非旨在提供,也不構成TradingView提供或認可的任何形式的財務、投資、交易或其他類型的建議或推薦。請閱讀使用條款以了解更多資訊。