
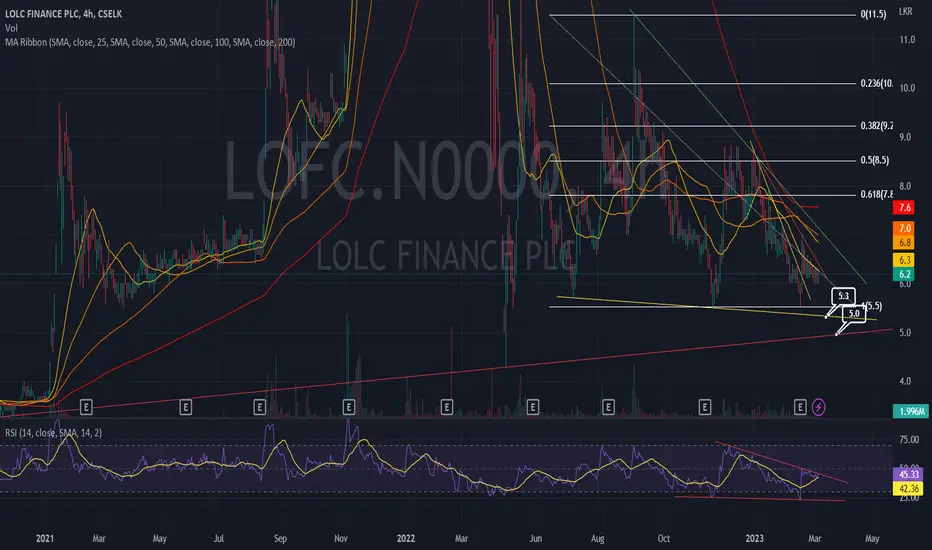
While moving below all SMA, LOFC seems having good volumes coming in at current levels.
trendline supports can be seen in 5.3 and 5.0 respectively. However given the nature of the counter, below 5.0 should be the
immediate stoploss for traders who takes positions at above levels.
RSI shows about to breakout its trendline
PS - go through the chart thoroughly, i have added much information in it.
trendline supports can be seen in 5.3 and 5.0 respectively. However given the nature of the counter, below 5.0 should be the
immediate stoploss for traders who takes positions at above levels.
RSI shows about to breakout its trendline
PS - go through the chart thoroughly, i have added much information in it.

免責聲明
這些資訊和出版物並非旨在提供,也不構成TradingView提供或認可的任何形式的財務、投資、交易或其他類型的建議或推薦。請閱讀使用條款以了解更多資訊。
免責聲明
這些資訊和出版物並非旨在提供,也不構成TradingView提供或認可的任何形式的財務、投資、交易或其他類型的建議或推薦。請閱讀使用條款以了解更多資訊。