
Descripción:
This is a weekly chart and a months long idea, and I am taking it
at the open. If you trade in days, this one is not for you.
THE LEVEL
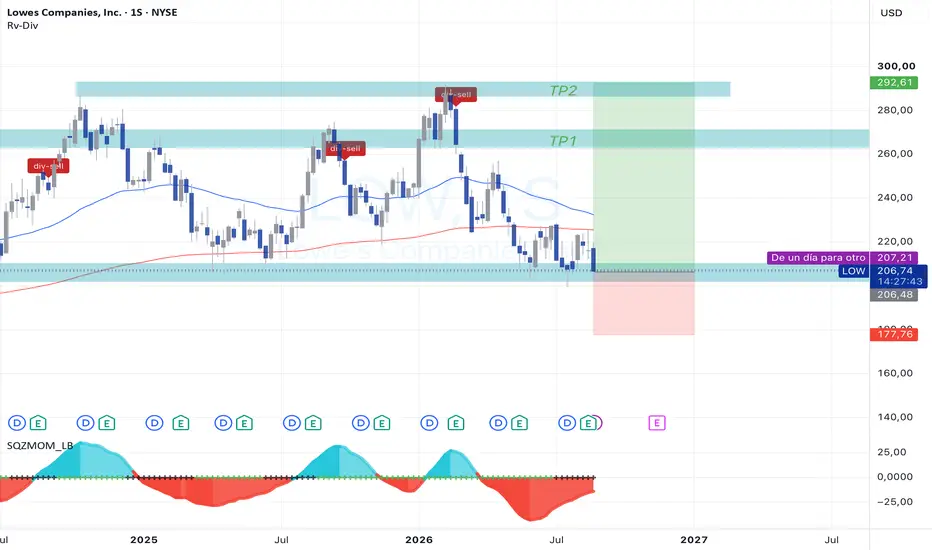
Price is at 207. That band has stopped every decline since 2023. Four times price has come down into it and four times it has gone back up. It is not a line I drew because it looks nice, it is where the buyers have shown up for three years.
Right now the weekly oscillator is at its lowest reading of the entire chart. Deeper than 2023, deeper than any of the pullbacks in between. That is not a reason to buy on its own, but it is what a washed out low looks like while it is happening rather than after.
THE PLAN
Long around 207.
First target 265, the 2025 highs.
Second target 292, the 2026 high.
Invalidation on a weekly close below 178.
That is roughly 28 percent to the first target and 41 percent to the second, against 14 percent of risk. Two to one on the first leg and three to one if it runs.
WHAT KILLS IT
A weekly close under 178. Not an intraweek spike, a close. If that shelf goes after holding for three years, the character of the stock has changed and I am not going to argue with the chart about it.
EARNINGS
There are several inside this window and I am not going to pretend otherwise. On an idea that runs for months you cannot avoid them, you can only size for them. If you cannot hold through a bad print, hold less.
ABOUT THE INDICATOR ON THE CHART
Those div-sell labels are Rv-Div, my divergence indicator. It is free and open on my profile. It marked every one of the tops on this chart, which is why I left it on.
But I have to be straight about something: Rv-Div is a daily tool. That is where I measured it and where the numbers hold up. This is a weekly chart, and what you see here is outside where I tested it. It called these tops and I am not going to hide that, but I am also not going to sell you a weekly signal I never measured.
It has not marked a buy here. That is not a contradiction, it just has not fired.
---
**ESPANOL**
Esto es un gráfico semanal y una idea de meses. Si operas en días, esta no es para ti.
EL NIVEL
El precio está en 207. Esa banda ha frenado todas las caídas desde 2023. Cuatro veces ha bajado a ella y cuatro veces ha vuelto a subir. No es una línea que dibujé porque queda bonita, es donde llevan tres años apareciendo los compradores.
Ahora mismo el oscilador semanal está en su lectura más baja de todo el gráfico. Más profunda que en 2023 y más que cualquiera de los retrocesos intermedios. Eso por sí solo no es motivo para comprar, pero es lo que parece un suelo lavado mientras está pasando, no después.
EL PLAN
Largo sobre 207.
Primer objetivo 265, los máximos de 2025.
Segundo objetivo 292, el máximo de 2026.
Invalidación con cierre semanal por debajo de 178.
Eso es un 28 por ciento al primer objetivo y un 41 al segundo, contra un 14 de riesgo. Dos a uno en el primer tramo y tres a uno si corre.
QUE LO MATA
Un cierre semanal bajo 178. No una mecha, un cierre. Si ese suelo cae después de aguantar tres años, la acción ha cambiado de carácter y no voy a discutirlo con el gráfico.
RESULTADOS
Hay varios dentro de esta ventana y no voy a fingir que no. En una idea de meses no se pueden esquivar, solo se puede dimensionar contando con ellos. Si no puedes aguantar unos malos resultados, aguanta menos posición.
SOBRE EL INDICADOR DEL GRAFICO
Esas etiquetas div-sell son Rv-Div, mi indicador de divergencias. Es gratis y está abierto en mi perfil. Marcó todos los techos de este gráfico, y por eso lo dejé puesto.
Pero tengo que ser claro con una cosa: Rv-Div es una herramienta de diario. Ahí es donde lo medí y donde los números aguantan. Esto es un semanal, y lo que ves aquí está fuera de donde lo probé. Marcó estos techos y no lo voy a esconder, pero tampoco te voy a vender una señal semanal que nunca medí.
Aquí no ha marcado ninguna compra. No es una contradicción, simplemente no ha saltado.
This is a weekly chart and a months long idea, and I am taking it
at the open. If you trade in days, this one is not for you.
THE LEVEL
Price is at 207. That band has stopped every decline since 2023. Four times price has come down into it and four times it has gone back up. It is not a line I drew because it looks nice, it is where the buyers have shown up for three years.
Right now the weekly oscillator is at its lowest reading of the entire chart. Deeper than 2023, deeper than any of the pullbacks in between. That is not a reason to buy on its own, but it is what a washed out low looks like while it is happening rather than after.
THE PLAN
Long around 207.
First target 265, the 2025 highs.
Second target 292, the 2026 high.
Invalidation on a weekly close below 178.
That is roughly 28 percent to the first target and 41 percent to the second, against 14 percent of risk. Two to one on the first leg and three to one if it runs.
WHAT KILLS IT
A weekly close under 178. Not an intraweek spike, a close. If that shelf goes after holding for three years, the character of the stock has changed and I am not going to argue with the chart about it.
EARNINGS
There are several inside this window and I am not going to pretend otherwise. On an idea that runs for months you cannot avoid them, you can only size for them. If you cannot hold through a bad print, hold less.
ABOUT THE INDICATOR ON THE CHART
Those div-sell labels are Rv-Div, my divergence indicator. It is free and open on my profile. It marked every one of the tops on this chart, which is why I left it on.
But I have to be straight about something: Rv-Div is a daily tool. That is where I measured it and where the numbers hold up. This is a weekly chart, and what you see here is outside where I tested it. It called these tops and I am not going to hide that, but I am also not going to sell you a weekly signal I never measured.
It has not marked a buy here. That is not a contradiction, it just has not fired.
---
**ESPANOL**
Esto es un gráfico semanal y una idea de meses. Si operas en días, esta no es para ti.
EL NIVEL
El precio está en 207. Esa banda ha frenado todas las caídas desde 2023. Cuatro veces ha bajado a ella y cuatro veces ha vuelto a subir. No es una línea que dibujé porque queda bonita, es donde llevan tres años apareciendo los compradores.
Ahora mismo el oscilador semanal está en su lectura más baja de todo el gráfico. Más profunda que en 2023 y más que cualquiera de los retrocesos intermedios. Eso por sí solo no es motivo para comprar, pero es lo que parece un suelo lavado mientras está pasando, no después.
EL PLAN
Largo sobre 207.
Primer objetivo 265, los máximos de 2025.
Segundo objetivo 292, el máximo de 2026.
Invalidación con cierre semanal por debajo de 178.
Eso es un 28 por ciento al primer objetivo y un 41 al segundo, contra un 14 de riesgo. Dos a uno en el primer tramo y tres a uno si corre.
QUE LO MATA
Un cierre semanal bajo 178. No una mecha, un cierre. Si ese suelo cae después de aguantar tres años, la acción ha cambiado de carácter y no voy a discutirlo con el gráfico.
RESULTADOS
Hay varios dentro de esta ventana y no voy a fingir que no. En una idea de meses no se pueden esquivar, solo se puede dimensionar contando con ellos. Si no puedes aguantar unos malos resultados, aguanta menos posición.
SOBRE EL INDICADOR DEL GRAFICO
Esas etiquetas div-sell son Rv-Div, mi indicador de divergencias. Es gratis y está abierto en mi perfil. Marcó todos los techos de este gráfico, y por eso lo dejé puesto.
Pero tengo que ser claro con una cosa: Rv-Div es una herramienta de diario. Ahí es donde lo medí y donde los números aguantan. Esto es un semanal, y lo que ves aquí está fuera de donde lo probé. Marcó estos techos y no lo voy a esconder, pero tampoco te voy a vender una señal semanal que nunca medí.
Aquí no ha marcado ninguna compra. No es una contradicción, simplemente no ha saltado.

免責聲明
這些資訊和出版物並非旨在提供,也不構成TradingView提供或認可的任何形式的財務、投資、交易或其他類型的建議或推薦。請閱讀使用條款以了解更多資訊。
免責聲明
這些資訊和出版物並非旨在提供,也不構成TradingView提供或認可的任何形式的財務、投資、交易或其他類型的建議或推薦。請閱讀使用條款以了解更多資訊。