做多
LRCUSDT - Dailly analysis
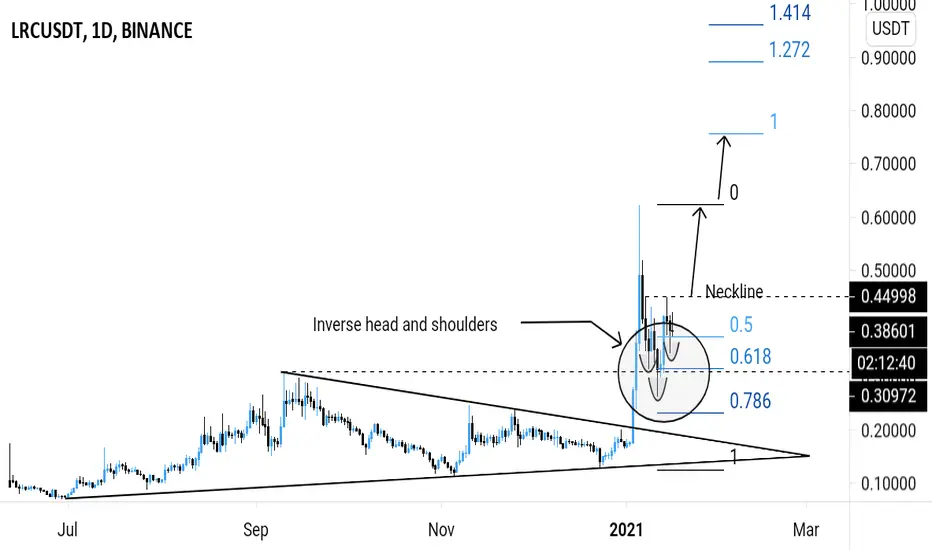
LRCUSDT brokeout above the symmetrical triangle pattern as expected from my previous analysis.
Price hit the ATH and retraced.
Price is testing the flip horizontal support + 0.618 fibonacci retracement level.
A bullish pin bar ( hammer ) was formed on the Daily timeframe.
Price action is printing the inverse head and shoulders reversal pattern.
Possible uptrend continuation.
Buy entry ⬆️ - breakout above the inverse head and shoulders neckline resistance.
Targets 🎯 - previous swing high (ATH), fibonacci extension levels.
Setup invalidation ❌ - breakdown below the inverse shoulders support level.
Price hit the ATH and retraced.
Price is testing the flip horizontal support + 0.618 fibonacci retracement level.
A bullish pin bar ( hammer ) was formed on the Daily timeframe.
Price action is printing the inverse head and shoulders reversal pattern.
Possible uptrend continuation.
Buy entry ⬆️ - breakout above the inverse head and shoulders neckline resistance.
Targets 🎯 - previous swing high (ATH), fibonacci extension levels.
Setup invalidation ❌ - breakdown below the inverse shoulders support level.

免責聲明
這些資訊和出版物並非旨在提供,也不構成TradingView提供或認可的任何形式的財務、投資、交易或其他類型的建議或推薦。請閱讀使用條款以了解更多資訊。