A week ago, we examined the LTC chart and the downward falling wedge pattern we observed (medium.com/@BitOoda/ltc-chart-and-btc-call-writing-afdb16f55d73). As of last night, LTC has broken through that $75 level and is trading a few dollars south of $75 this morning. All we see is ‘air’ down to $60, meaning that if a selloff precipitates throughout the crypto space, we do not see much support until the $60 level.
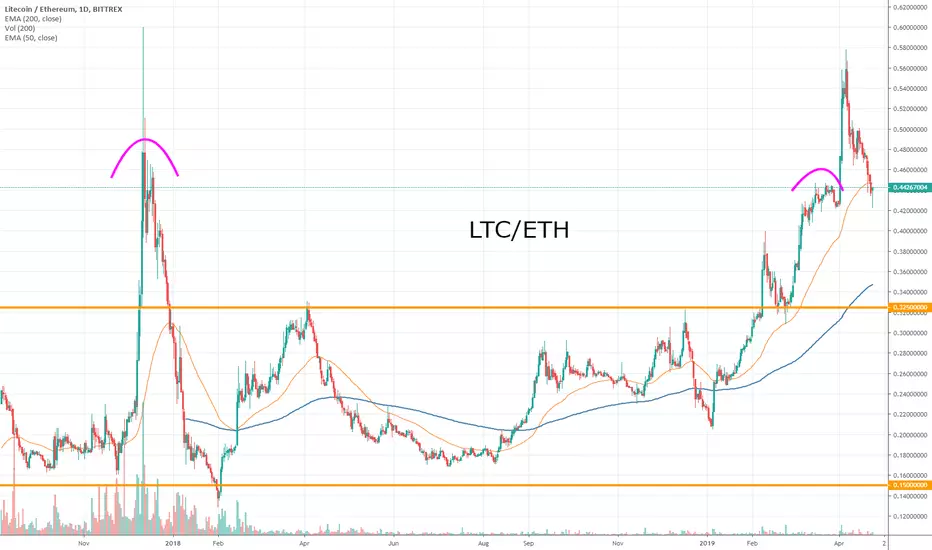
Another chart that had caught our eye we wrote about on March 26th, the LTC/ETH Trading Pair (medium.com/@BitOoda/ltc-eth-trading-pair-3675705b626c). We happened to put this “Mean Reversion” trading piece out right before the April 1st crypto rally, which caused the trading pair to appear as though it was making a massive break-out. As prices have settled down and consolidated over the last month, we see this trading pair has made a retracement right back to the ~0.438 level of late March. We believe this confirms our thesis, along with the price action seen in December, that the trading pair will not be sustainable north of 0.500.
Another chart that had caught our eye we wrote about on March 26th, the LTC/ETH Trading Pair (medium.com/@BitOoda/ltc-eth-trading-pair-3675705b626c). We happened to put this “Mean Reversion” trading piece out right before the April 1st crypto rally, which caused the trading pair to appear as though it was making a massive break-out. As prices have settled down and consolidated over the last month, we see this trading pair has made a retracement right back to the ~0.438 level of late March. We believe this confirms our thesis, along with the price action seen in December, that the trading pair will not be sustainable north of 0.500.

免責聲明
這些資訊和出版物並非旨在提供,也不構成TradingView提供或認可的任何形式的財務、投資、交易或其他類型的建議或推薦。請閱讀使用條款以了解更多資訊。
免責聲明
這些資訊和出版物並非旨在提供,也不構成TradingView提供或認可的任何形式的財務、投資、交易或其他類型的建議或推薦。請閱讀使用條款以了解更多資訊。