
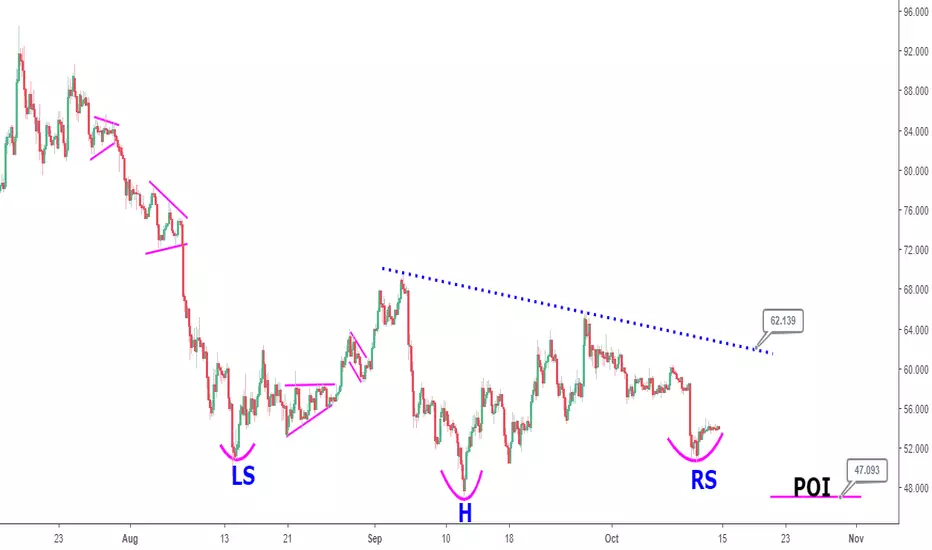
The 4 hour timeframe of Litecoin (LTCUSD) is captured in this analysis from July 24, 2018 to current date. In particular, August 14, 2018 to current date appears to be shaping up as an inverted head and shoulders pattern (or head and shoulders bottom).
The left shoulder (LS), right shoulder (RS) and possible Head (H) of the pattern are marked on the chart. A close above the downward sloping line at ~$62.14, taken as the neckline would confirm the pattern, whose implication is ideally bullish.
Price closing below ~$47.10 (point of invalidation = POI) before closing above $62.14 would invalidate the formation of the bullish pattern in Litecoin.
The left shoulder (LS), right shoulder (RS) and possible Head (H) of the pattern are marked on the chart. A close above the downward sloping line at ~$62.14, taken as the neckline would confirm the pattern, whose implication is ideally bullish.
Price closing below ~$47.10 (point of invalidation = POI) before closing above $62.14 would invalidate the formation of the bullish pattern in Litecoin.

免責聲明
這些資訊和出版物並非旨在提供,也不構成TradingView提供或認可的任何形式的財務、投資、交易或其他類型的建議或推薦。請閱讀使用條款以了解更多資訊。