
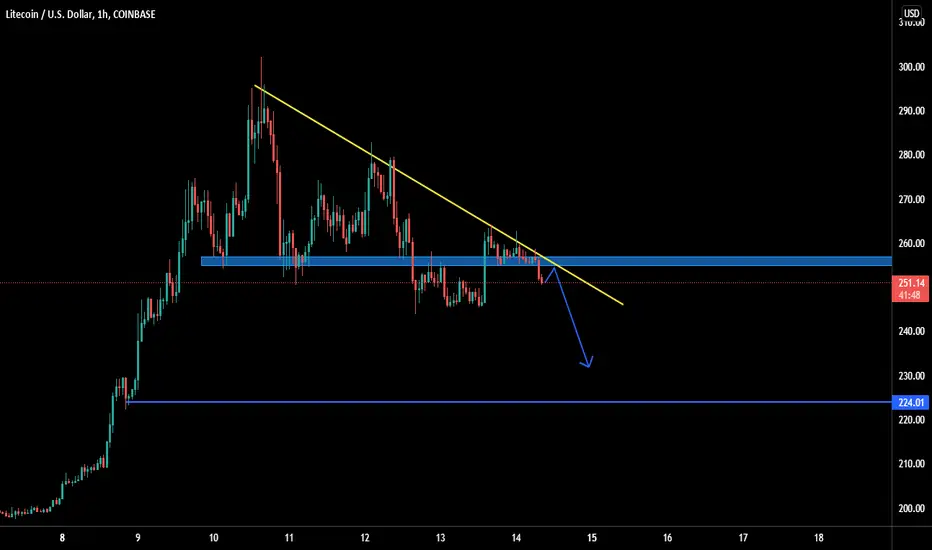
A descending triangle is a bearish chart pattern used in technical analysis that is created by drawing one trend line that connects a series of lower highs and a second horizontal trend line that connects a series of lows. Oftentimes, traders watch for a move below the lower support trend line because it suggests that the downward momentum is building and a breakdown is imminent. Once the breakdown occurs, traders enter into short positions and aggressively help push the price of the asset even lower.
KEY TAKEAWAYS
1. A descending triangle is a signal for traders to take a short position to accelerate a breakdown.
2. A descending triangle is detectable by drawing trend lines for the highs and lows on a chart.
3. A descending triangle is the counterpart of an ascending triangle, which is another trend line-based chart pattern used by technical analysts.

免責聲明
這些資訊和出版物並非旨在提供,也不構成TradingView提供或認可的任何形式的財務、投資、交易或其他類型的建議或推薦。請閱讀使用條款以了解更多資訊。