
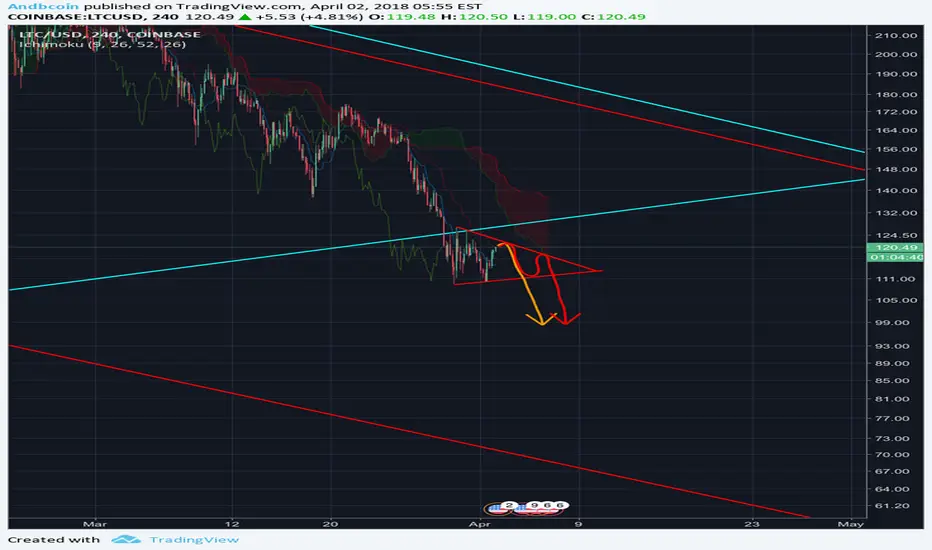
It’s not the bottom. Just another bearish triangle.
Ichimoku showing bearish trend.
Broken support that now acts as a resistance.
RSI oversold, so it has to “reset” by pumping a bit. As I can see, when it’s oversold, it pumps a bit, dumps deeper, and so on to keep resetting the RSI.
Ichimoku showing bearish trend.
Broken support that now acts as a resistance.
RSI oversold, so it has to “reset” by pumping a bit. As I can see, when it’s oversold, it pumps a bit, dumps deeper, and so on to keep resetting the RSI.
註釋
Hi, there! I've seen the triangle has to be adjusted according to the new price and maybe it isn't a triangle but a flag. The previous price made me think it was a triangle. It will not go further than 126 - 127 dollars. Sorry for this mistake.
註釋
New update according to the new price level.Trade carefully:).
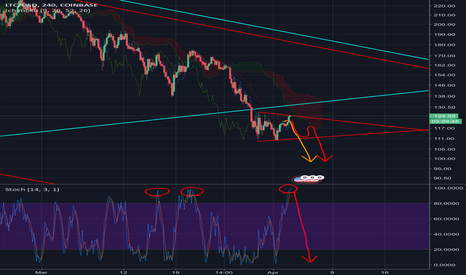
註釋
I want to update the info because it resulted in a bearish flag more than in a bearish triangle. I don’t see LTC going any further since Stochastics is at the maximum level and it has to go down again.註釋
LTC is unable to get through the blue resistance. But if it does, it means it’s a clear trap and some people will lose their money. I wouldn’t trade with this scenario, but as I always say, trade at your own risk and do what you consider to be right. :)

免責聲明
這些資訊和出版物並非旨在提供,也不構成TradingView提供或認可的任何形式的財務、投資、交易或其他類型的建議或推薦。請閱讀使用條款以了解更多資訊。