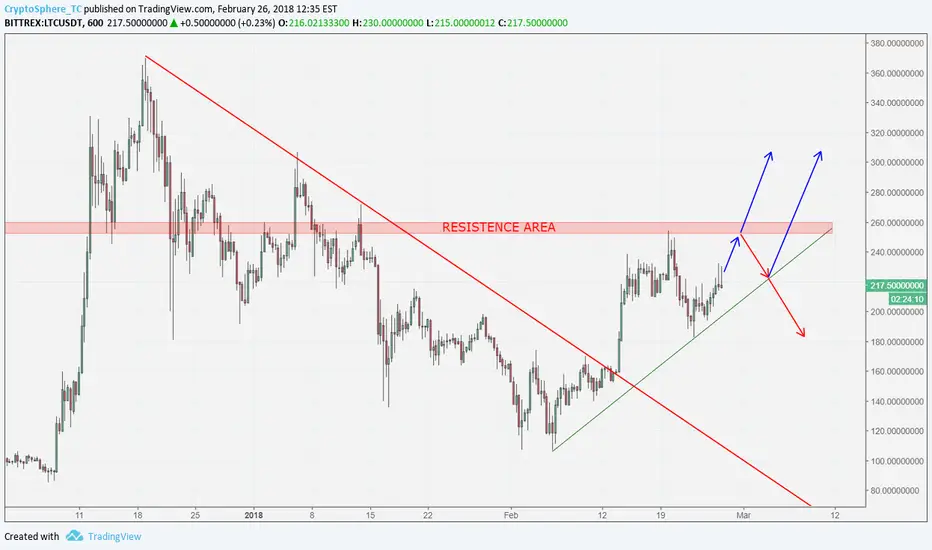
The price, after breaking down the bearish trendline, created a huge bullish impulse until about 250 USDT. Then it retraced on the support placed at 180 USDT. At the moment, the rebound happened on that support shows positive signals. These aforementioned signals may suggest a coming back nearby the resistence area (underlined by the red rectangle). In case of a breakdown of the resistence area a huge bullish impulse may happen. On the countrary, if the trendline represented in green colour was broken down, the price might come back towards 180 USDT. It can be recommended to consider an eventual entering when the resistence area breaks down always setting the stop loss.

免責聲明
這些資訊和出版物並非旨在提供,也不構成TradingView提供或認可的任何形式的財務、投資、交易或其他類型的建議或推薦。請閱讀使用條款以了解更多資訊。
免責聲明
這些資訊和出版物並非旨在提供,也不構成TradingView提供或認可的任何形式的財務、投資、交易或其他類型的建議或推薦。請閱讀使用條款以了解更多資訊。