
Hello Crypto Lovers,
Mars Signals team wishes you high profits.
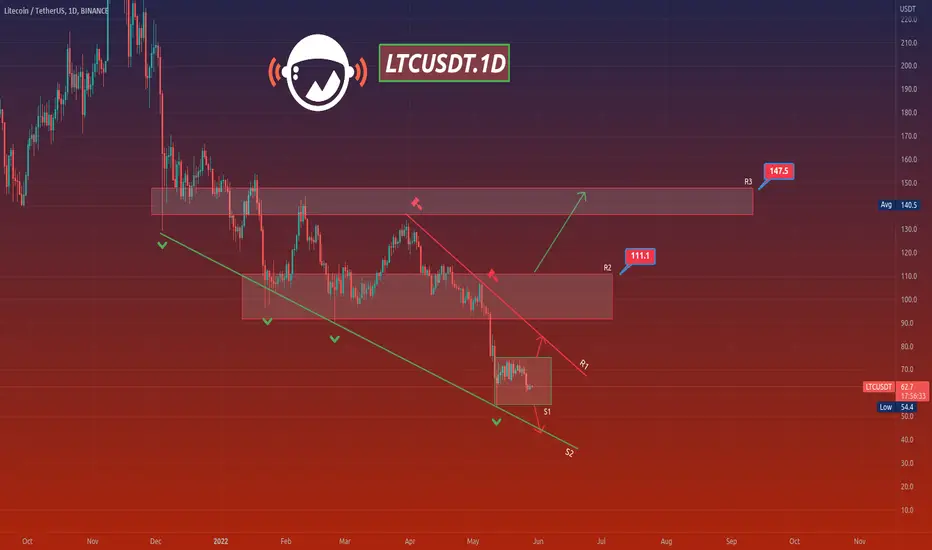
This is a one-day-time frame analysis for LTCUSDT
As you see in this chart, the price lost its previous support line (R3) and now it is fluctuating in a descending channel. The R1 line shows that price was not able to rise again and continued its decline down to the S2 line and at the moment it has a fluctuation above this line. The price is seen in a support area and in case it leaves this area and moves upward, we will have more rise for it up to the R2 and R3 areas. Also it is possible that the price loses the support area and moves below the S2 line and then has a pull back upward and have more rise.
Warning: This is just a suggestion and we do not guarantee profits. We advise you to analyze the chart before opening any positions.
Wish you luck

免責聲明
這些資訊和出版物並非旨在提供,也不構成TradingView提供或認可的任何形式的財務、投資、交易或其他類型的建議或推薦。請閱讀使用條款以了解更多資訊。
免責聲明
這些資訊和出版物並非旨在提供,也不構成TradingView提供或認可的任何形式的財務、投資、交易或其他類型的建議或推薦。請閱讀使用條款以了解更多資訊。