
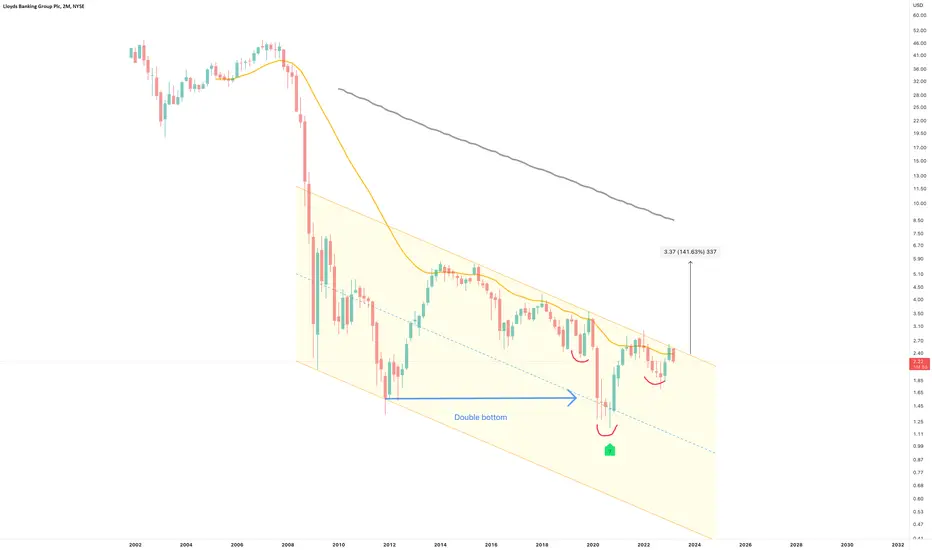
Talk about a 180. As soon as the JP idea is finished L for Lloyds is next, and my what a different picture. It seems as banks in the USA collapse that UK banks are set to see some serious cash inflow.
On the above 2-month chart price action has corrected over 90% from 2007 and never recovered. Until now. A number of reasons now exist to be long, including:
1) A strong buy signal (not shown) prints.
2) Regular bullish divergence. No less than seven oscillators. Four to five oscillators printing on this time frame is incredibly powerful but seven?!
3) Inverse head and shoulders pattern confirms with a break above 2.80 with a 5.80 target.
Is it possible price action falls further? Sure.
Is it probable? No.
Type: Investment
Risk: <=6% of portfolio
Timeframe: Don’t know.
Return: 140% to begin with.
Stop loss: 1.60
On the above 2-month chart price action has corrected over 90% from 2007 and never recovered. Until now. A number of reasons now exist to be long, including:
1) A strong buy signal (not shown) prints.
2) Regular bullish divergence. No less than seven oscillators. Four to five oscillators printing on this time frame is incredibly powerful but seven?!
3) Inverse head and shoulders pattern confirms with a break above 2.80 with a 5.80 target.
Is it possible price action falls further? Sure.
Is it probable? No.
Type: Investment
Risk: <=6% of portfolio
Timeframe: Don’t know.
Return: 140% to begin with.
Stop loss: 1.60
交易進行
Support confirmed.手動結束交易
Going to close this one, an older investment for me with a good return.Better opportunities exist elsewhere.
Furthermore, there's an itching feeling UK Banking services is about to take a swandive into the abyss, not sure I want to participate.
10 day

免責聲明
這些資訊和出版物並非旨在提供,也不構成TradingView提供或認可的任何形式的財務、投資、交易或其他類型的建議或推薦。請閱讀使用條款以了解更多資訊。
免責聲明
這些資訊和出版物並非旨在提供,也不構成TradingView提供或認可的任何形式的財務、投資、交易或其他類型的建議或推薦。請閱讀使用條款以了解更多資訊。