做空
MAIDBTC Possible H&S formation
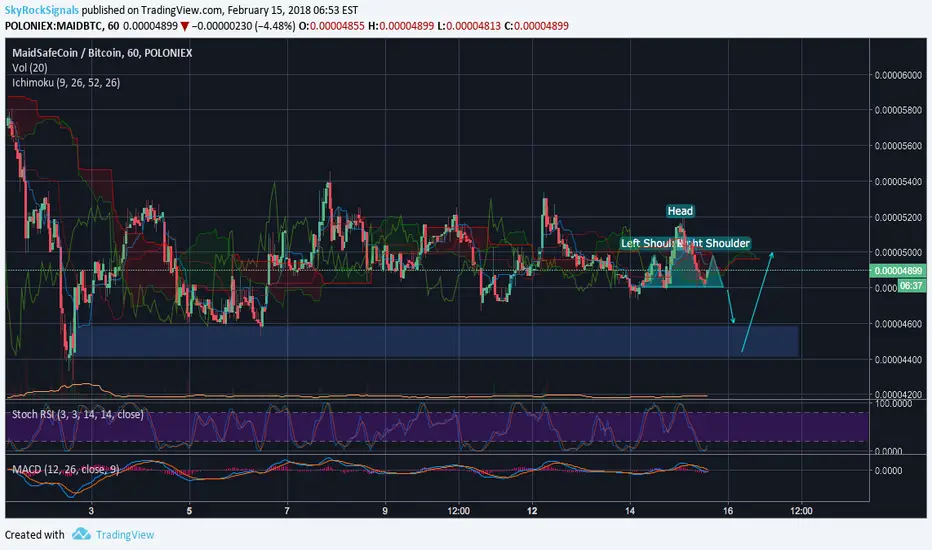
We detected a possible H&S formation. The price is currently below the Ichimoku cloud while Stoch RSI indicates oversold zone, volume is rising, hence the price will go up to the upper edge of Ichi red resistance line. Then it will go down finishing H&S formation as Hull Moving Average (9) and Exponential/Simple Moving averages 200 indicate sell time. The price will fall till the blue zone where it is a perfect time to enter the market.

Turn TradingView indicator & strategy alerts into automated trades on major crypto exchanges using no-code bots
Start free at skyrexio.com
Start free at skyrexio.com
免責聲明
這些資訊和出版物並非旨在提供,也不構成TradingView提供或認可的任何形式的財務、投資、交易或其他類型的建議或推薦。請閱讀使用條款以了解更多資訊。
Turn TradingView indicator & strategy alerts into automated trades on major crypto exchanges using no-code bots
Start free at skyrexio.com
Start free at skyrexio.com
免責聲明
這些資訊和出版物並非旨在提供,也不構成TradingView提供或認可的任何形式的財務、投資、交易或其他類型的建議或推薦。請閱讀使用條款以了解更多資訊。