
 MANA (Decentraland) is currently trading in a high-probability demand zone on the higher time frame. Price is sitting near the macro bottom area, which makes this structure very interesting for swing and intraday traders.
Higher Time Frame Context
Price is positioned near a major bottom zone
Strong reaction area historically
No clear bearish continuation signals
Structure suggesting potential trend reversal
1H Time Frame Setup
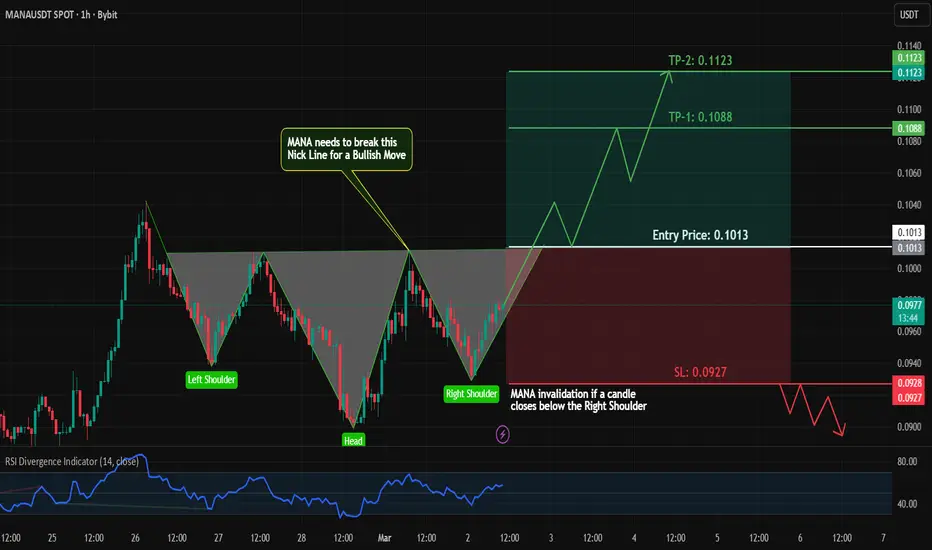
On the 1-hour chart, #MANA is forming a clean Inverse Head & Shoulders pattern:
Left shoulder formed
Head completed with strong rejection
Right shoulder currently developing
Waiting for neckline breakout confirmation
There are no strong bearish signs at the moment, which increases the probability of a bullish breakout scenario.
Trade Plan (Rule-Based Approach)
Entry Strategy:
Wait for a confirmed breakout above the neckline
Enter on the retest of neckline support
Stop Loss:
Below right shoulder low
Targets:
Previous resistance zones
Pattern-measured move projection
No breakout = No trade. Patience is key.
Why This Setup Matters
Bottom HTF structure + Bullish reversal pattern confluence
Clean invalidation level
Favorable risk-to-reward potential
Market structure shifting from accumulation to possible markup phase
If breakout volume confirms, this could offer a strong upside opportunity.
What’s your bias on #MANA?
Are you waiting for breakout or already accumulating?
👍 Like | 💬 Comment | 🔔 Follow for more high-probability setups with proper risk management.
#MANA #Crypto #Altcoins #TechnicalAnalysis #InverseHeadAndShoulders #BreakoutTrade #SmartMoney #PriceAction #TradingView #RiskManagement
交易進行
Trade is active, but MANA hasn’t properly broken the neckline yet. Waiting for a strong candle close above it for confirmation.
免責聲明
這些資訊和出版物並非旨在提供,也不構成TradingView提供或認可的任何形式的財務、投資、交易或其他類型的建議或推薦。請閱讀使用條款以了解更多資訊。
免責聲明
這些資訊和出版物並非旨在提供,也不構成TradingView提供或認可的任何形式的財務、投資、交易或其他類型的建議或推薦。請閱讀使用條款以了解更多資訊。