MATIC/BTC 1D Short Term
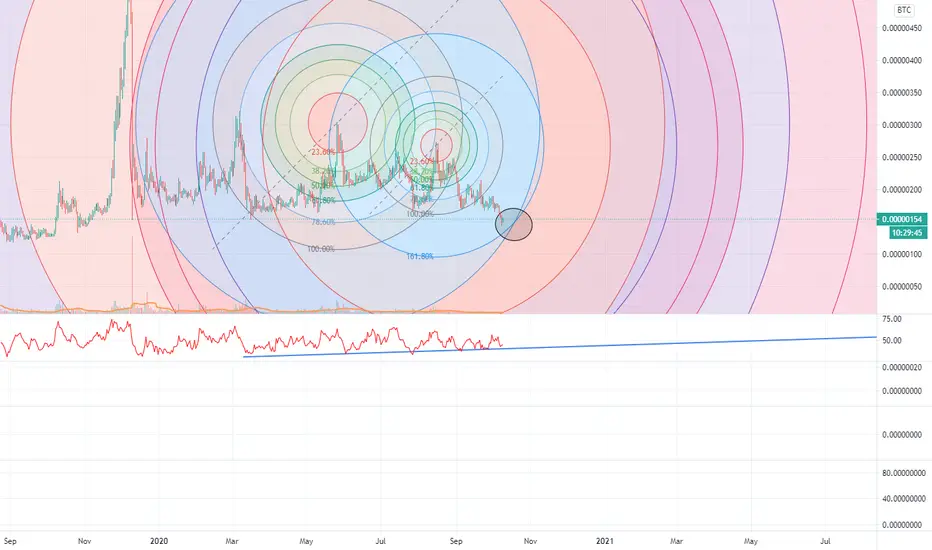
Short term we will drop to 140 sat area, see dark circle that indicates a support/resistance area. After that a rise is possible back to 170 sat area for the first target.
Also see the ultimate oscillator here. The line below the indicator indicates a last drop back to the line, before rising again.
No advice from me, i just look at the charts :)
Also see the ultimate oscillator here. The line below the indicator indicates a last drop back to the line, before rising again.
No advice from me, i just look at the charts :)

免責聲明
這些資訊和出版物並非旨在提供,也不構成TradingView提供或認可的任何形式的財務、投資、交易或其他類型的建議或推薦。請閱讀使用條款以了解更多資訊。