做多
MATICUSDT
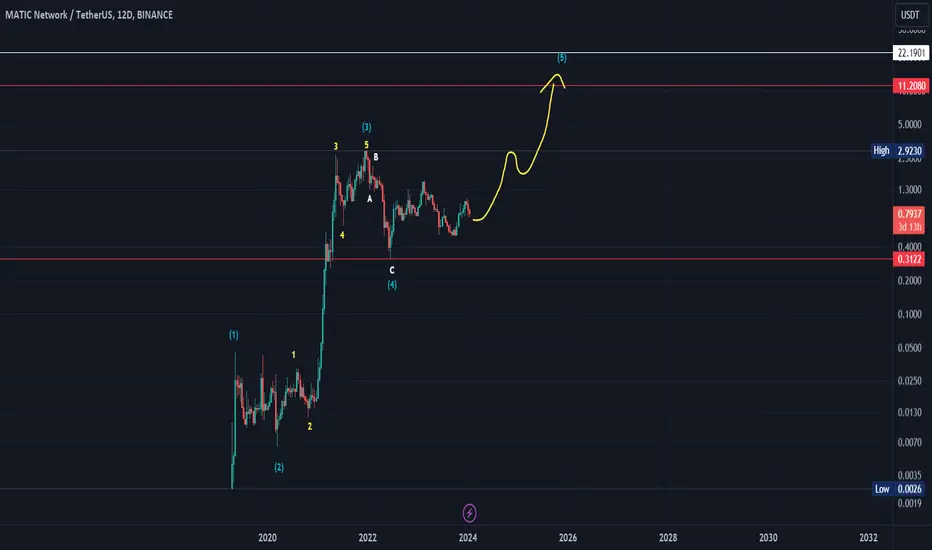
From the data shown on the chart, we find that as long as the currency does not break the bottom of the area 0.5 usdt , this indicates the accumulation of a new wave of payment, in addition to the fact that the currency against Bitcoin has been going sideways for 31 monthly candles, and this indicates the upcoming stages of accumulation and a calming of the previous indicators of inflation.
All data on the chart.. Good luck
All data on the chart.. Good luck
取消訂單

免責聲明
這些資訊和出版物並非旨在提供,也不構成TradingView提供或認可的任何形式的財務、投資、交易或其他類型的建議或推薦。請閱讀使用條款以了解更多資訊。
免責聲明
這些資訊和出版物並非旨在提供,也不構成TradingView提供或認可的任何形式的財務、投資、交易或其他類型的建議或推薦。請閱讀使用條款以了解更多資訊。