MATIC/USDT 4H Chart Review
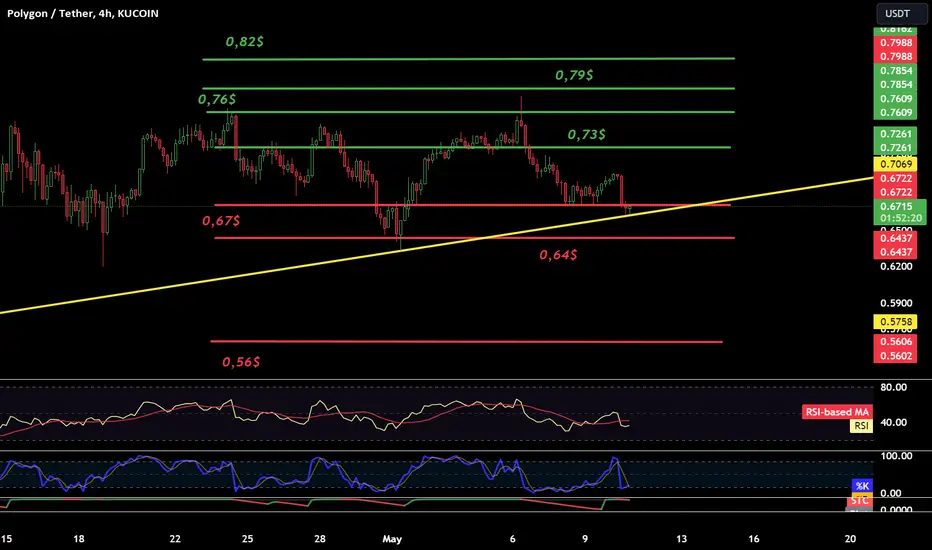
Hello everyone, let's look at the 4H MATIC to USDT chart as we can see that the price is staying on a lopsided uptrend line.
Let's start by setting goals for the near future that we can include:
T1 = $0.73
T2 = $0.76
T3 = $0.79
AND
T4 = $0.82
Now let's move on to the stop-loss in case of further market declines:
SL1 = $0.67
SL2 = $0.64
AND
SL3 = $0.56
When we look at the RSI and STOCH indicators, we can see that the indicators are low and we additionally rely on the trend line, which may affect the price maintenance.
Let's start by setting goals for the near future that we can include:
T1 = $0.73
T2 = $0.76
T3 = $0.79
AND
T4 = $0.82
Now let's move on to the stop-loss in case of further market declines:
SL1 = $0.67
SL2 = $0.64
AND
SL3 = $0.56
When we look at the RSI and STOCH indicators, we can see that the indicators are low and we additionally rely on the trend line, which may affect the price maintenance.

免責聲明
這些資訊和出版物並非旨在提供,也不構成TradingView提供或認可的任何形式的財務、投資、交易或其他類型的建議或推薦。請閱讀使用條款以了解更多資訊。
免責聲明
這些資訊和出版物並非旨在提供,也不構成TradingView提供或認可的任何形式的財務、投資、交易或其他類型的建議或推薦。請閱讀使用條款以了解更多資訊。