MATIC Polygon: Concerns Ahead
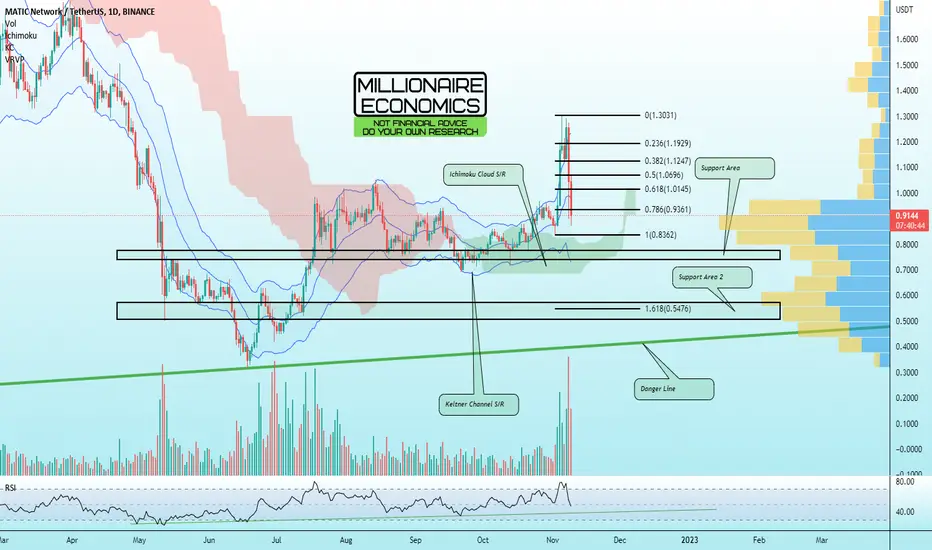
Today you can review the technical analysis idea on a 1D linear scale chart for Polygon (MATICUSDT).
The chart is self explanatory. I labeled the chart for Support and Resistance areas and lines. To support the analysis, I have included the Volume Profile (VPVR), Keltner Channels, Ichimoku Cloud, Fibonacci Retracement and RSI.
I have been calling drops on crypto since November and December of 2021. I am more concerned than before that more drops are coming. Be careful.
If you enjoy my ideas, feel free to like it and drop in a comment. I love reading your comments below.
Disclosure: This is just my opinion and not any type of financial advice. I enjoy charting and discussing technical analysis . Don't trade based on my advice. Do your own research! #millionaireeconomics
The chart is self explanatory. I labeled the chart for Support and Resistance areas and lines. To support the analysis, I have included the Volume Profile (VPVR), Keltner Channels, Ichimoku Cloud, Fibonacci Retracement and RSI.
I have been calling drops on crypto since November and December of 2021. I am more concerned than before that more drops are coming. Be careful.
If you enjoy my ideas, feel free to like it and drop in a comment. I love reading your comments below.
Disclosure: This is just my opinion and not any type of financial advice. I enjoy charting and discussing technical analysis . Don't trade based on my advice. Do your own research! #millionaireeconomics

免責聲明
這些資訊和出版物並非旨在提供,也不構成TradingView提供或認可的任何形式的財務、投資、交易或其他類型的建議或推薦。請閱讀使用條款以了解更多資訊。
免責聲明
這些資訊和出版物並非旨在提供,也不構成TradingView提供或認可的任何形式的財務、投資、交易或其他類型的建議或推薦。請閱讀使用條款以了解更多資訊。