做多
MATIC: Rising Wedge Breakout
Polygon (MATIC) technical analysis:
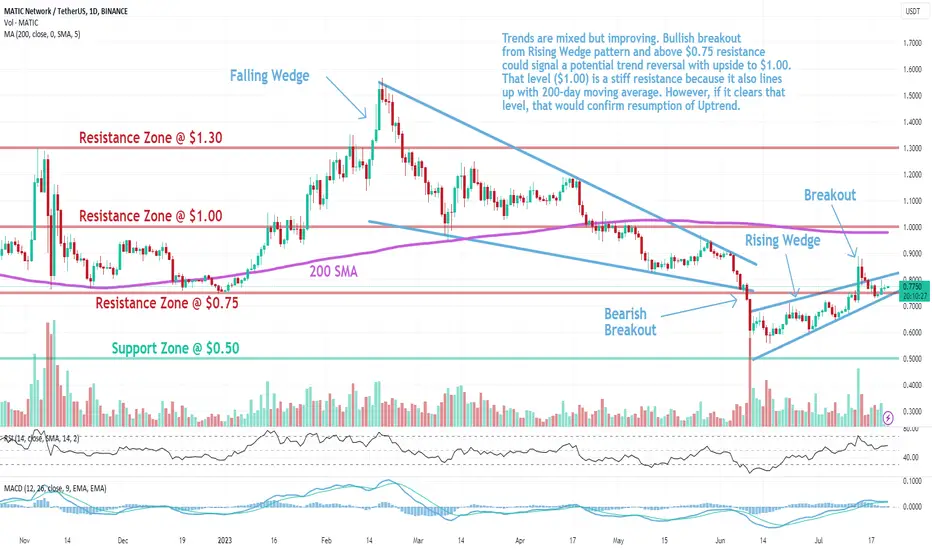
Trade setup: Trends are mixed but improving. Bullish breakout from Rising Wedge pattern and above $0.75 resistance could signal a potential trend reversal with upside to $1.00. That level ($1.00) is a stiff resistance because it also lines up with 200-day moving average. However, if it clears that level, that would confirm resumption of Uptrend.
Patterns: Rising Wedge It usually forms after an uptrend and suggests a potential bearish reversal in the original uptrend. When price breaks the lower trend line the price is expected to trend lower. Emerging patterns (before a breakout occurs) can be traded by swing traders between the convergence lines; however, most traders should wait for a completed pattern with a breakout.
Trend: Neutral on Short- and Medium-Term basis and Downtrend on Long-Term basis.
Momentum is Mixed as MACD Line is above MACD Signal Line (Bullish) but RSI ~ 50 (Neutral). MACD Histogram bars are declining, which suggests that momentum is weakening.
Support and Resistance: Nearest Support Zone is $0.50. The nearest Resistance Zone is $0.75, which it broke, then $1.00.
Trade setup: Trends are mixed but improving. Bullish breakout from Rising Wedge pattern and above $0.75 resistance could signal a potential trend reversal with upside to $1.00. That level ($1.00) is a stiff resistance because it also lines up with 200-day moving average. However, if it clears that level, that would confirm resumption of Uptrend.
Patterns: Rising Wedge It usually forms after an uptrend and suggests a potential bearish reversal in the original uptrend. When price breaks the lower trend line the price is expected to trend lower. Emerging patterns (before a breakout occurs) can be traded by swing traders between the convergence lines; however, most traders should wait for a completed pattern with a breakout.
Trend: Neutral on Short- and Medium-Term basis and Downtrend on Long-Term basis.
Momentum is Mixed as MACD Line is above MACD Signal Line (Bullish) but RSI ~ 50 (Neutral). MACD Histogram bars are declining, which suggests that momentum is weakening.
Support and Resistance: Nearest Support Zone is $0.50. The nearest Resistance Zone is $0.75, which it broke, then $1.00.

免責聲明
這些資訊和出版物並非旨在提供,也不構成TradingView提供或認可的任何形式的財務、投資、交易或其他類型的建議或推薦。請閱讀使用條款以了解更多資訊。