
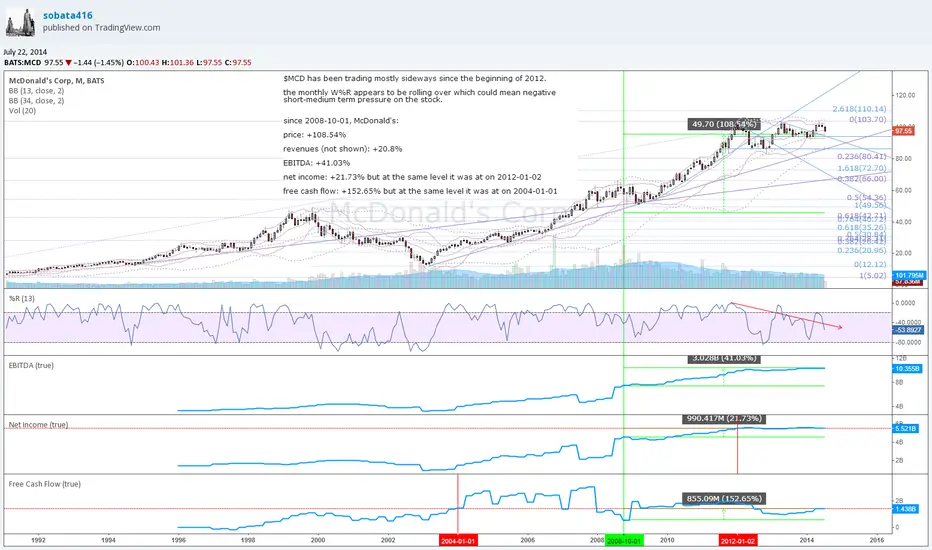
 MCD has been trading mostly sideways since the beginning of 2012.
the monthly W%R appears to be rolling over which could mean negative short-medium term pressure on the stock.
since 2008-10-01, McDonald's:
price: +108.54%
revenues (not shown): +20.8%
EBITDA: +41.03%
net income: +21.73% but at the same level it was at on 2012-01-02
free cash flow: +152.65% but at the same level it was at on 2004-01-01

免責聲明
這些資訊和出版物並非旨在提供,也不構成TradingView提供或認可的任何形式的財務、投資、交易或其他類型的建議或推薦。請閱讀使用條款以了解更多資訊。