MCOUSD
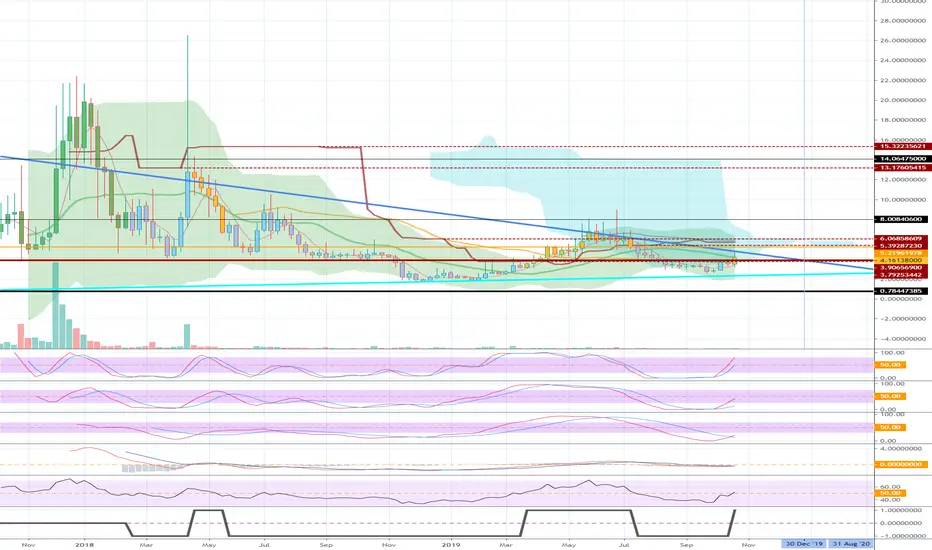
The MCO, a chart published for next year's profits, also rose above the basic 3.90656900 following the rise in BTC.
The price is currently forming around 20MA on the weekly chart.
Once the downtrend line is out and the stock splits slowly between the uptrend line and 3.90656900, we expect good results next year.
The price is currently forming around 20MA on the weekly chart.
Once the downtrend line is out and the stock splits slowly between the uptrend line and 3.90656900, we expect good results next year.

[Practical trading strategy using HA-MS and SBOD]
youtu.be/aceN1AttX1Y
youtu.be/aceN1AttX1Y
相關出版品
免責聲明
這些資訊和出版物並非旨在提供,也不構成TradingView提供或認可的任何形式的財務、投資、交易或其他類型的建議或推薦。請閱讀使用條款以了解更多資訊。
[Practical trading strategy using HA-MS and SBOD]
youtu.be/aceN1AttX1Y
youtu.be/aceN1AttX1Y
相關出版品
免責聲明
這些資訊和出版物並非旨在提供,也不構成TradingView提供或認可的任何形式的財務、投資、交易或其他類型的建議或推薦。請閱讀使用條款以了解更多資訊。