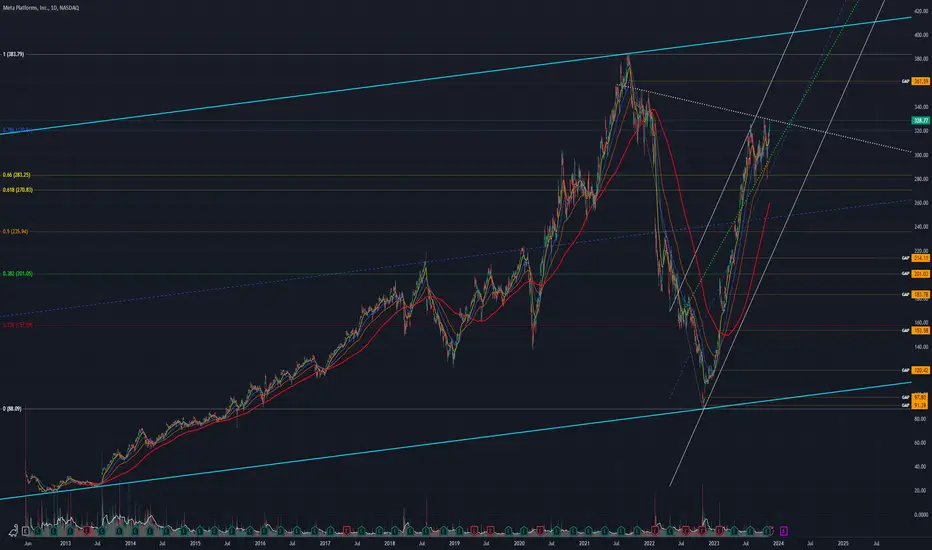
 META chart mapping/analysis.
Bullish consolidation higher within an ascending parallel channel (white).
Bull target(s)
- Breakout above descending trend-line resistance (white dotted)
- Overhead gap fill (~361.59)
- Prev ATH + upper range of parallel channel (light blue) confluence resistance zone
Bear target(s)
- Ascending trend-line support (green dotted)
- Golden Fib Pocket
- Lower range of ascending parallel channel (white)
- 50% Fib
- Underlying gap fills (~214.11 / ~201.03 / ~183.78)
- 38.2% + gap fill (~201.03) confluence support zone
註釋
Note: TradingView chart was dividend adjusted (ADJ) when mapped.
相關出版品
免責聲明
這些資訊和出版物並非旨在提供,也不構成TradingView提供或認可的任何形式的財務、投資、交易或其他類型的建議或推薦。請閱讀使用條款以了解更多資訊。