
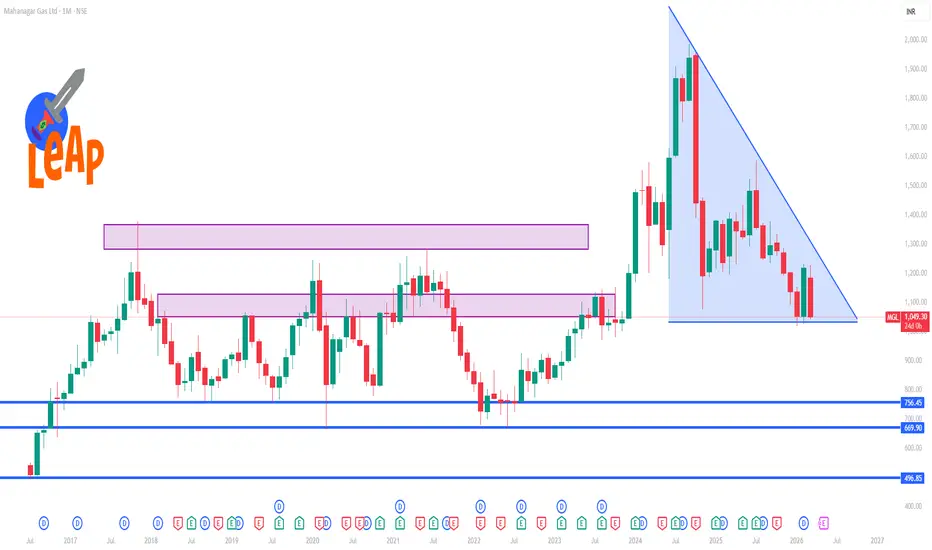
📌 Current Price Context
• Price ~ ₹1,049 – ₹1,070 per share at latest market close. The stock has traded between about ₹1,018 (52‑week low) and ₹1,587 (52‑week high) recently.
📊 1‑Month Support & Resistance Levels (Important)
Immediate Support (Downside Levels)
₹1,016 – ₹1,018 — Significant near 52‑week low support zone.
₹1,032 – ₹1,040 — Minor support zone from recent daily pivots.
₹1,054 — Short‑term support near current pivot zone.
👉 Below ₹1,016 could trigger further test of lower range around ₹980‑₹950 (more bearish extension).
Immediate Resistance (Upside Levels)
₹1,093 – ₹1,095 — First resistance from pivot breakout zones.
₹1,108 – ₹1,110 — Near mid‑range resistance cluster for the month.
₹1,120 – ₹1,130 — Next key ceiling where recent upside moves faced selling interest.
👉 Break above ₹1,130 could open a bullish move to next short‑term range around ₹1,150‑₹1,170.
📌 1‑Month Trading Interpretation
Bullish scenario:
➡️ If price holds above the ₹1,040‑₹1,054 support zone and clears ₹1,093–₹1,095, then look for a run toward ₹1,108‑₹1,120. A breakout above that could signal stronger momentum.
Bearish scenario:
➡️ If price breaks below ₹1,032‑₹1,018, risk expands into deeper support near the 52‑week low ~₹1,018 and potentially ₹950‑₹980 in an extended decline.
• Price ~ ₹1,049 – ₹1,070 per share at latest market close. The stock has traded between about ₹1,018 (52‑week low) and ₹1,587 (52‑week high) recently.
📊 1‑Month Support & Resistance Levels (Important)
Immediate Support (Downside Levels)
₹1,016 – ₹1,018 — Significant near 52‑week low support zone.
₹1,032 – ₹1,040 — Minor support zone from recent daily pivots.
₹1,054 — Short‑term support near current pivot zone.
👉 Below ₹1,016 could trigger further test of lower range around ₹980‑₹950 (more bearish extension).
Immediate Resistance (Upside Levels)
₹1,093 – ₹1,095 — First resistance from pivot breakout zones.
₹1,108 – ₹1,110 — Near mid‑range resistance cluster for the month.
₹1,120 – ₹1,130 — Next key ceiling where recent upside moves faced selling interest.
👉 Break above ₹1,130 could open a bullish move to next short‑term range around ₹1,150‑₹1,170.
📌 1‑Month Trading Interpretation
Bullish scenario:
➡️ If price holds above the ₹1,040‑₹1,054 support zone and clears ₹1,093–₹1,095, then look for a run toward ₹1,108‑₹1,120. A breakout above that could signal stronger momentum.
Bearish scenario:
➡️ If price breaks below ₹1,032‑₹1,018, risk expands into deeper support near the 52‑week low ~₹1,018 and potentially ₹950‑₹980 in an extended decline.

Contact Knowledgehub for a detailed consultation: Dm on WhatsApp: [wa.link/a2o0kz]-
Phone No: [+91 93102 26243]-
Email: [tradingviewknowledgehub@gmail.com]---
-- Let’s achieve success together!
Phone No: [+91 93102 26243]-
Email: [tradingviewknowledgehub@gmail.com]---
-- Let’s achieve success together!
相關出版品
免責聲明
這些資訊和出版物並非旨在提供,也不構成TradingView提供或認可的任何形式的財務、投資、交易或其他類型的建議或推薦。請閱讀使用條款以了解更多資訊。
Contact Knowledgehub for a detailed consultation: Dm on WhatsApp: [wa.link/a2o0kz]-
Phone No: [+91 93102 26243]-
Email: [tradingviewknowledgehub@gmail.com]---
-- Let’s achieve success together!
Phone No: [+91 93102 26243]-
Email: [tradingviewknowledgehub@gmail.com]---
-- Let’s achieve success together!
相關出版品
免責聲明
這些資訊和出版物並非旨在提供,也不構成TradingView提供或認可的任何形式的財務、投資、交易或其他類型的建議或推薦。請閱讀使用條款以了解更多資訊。