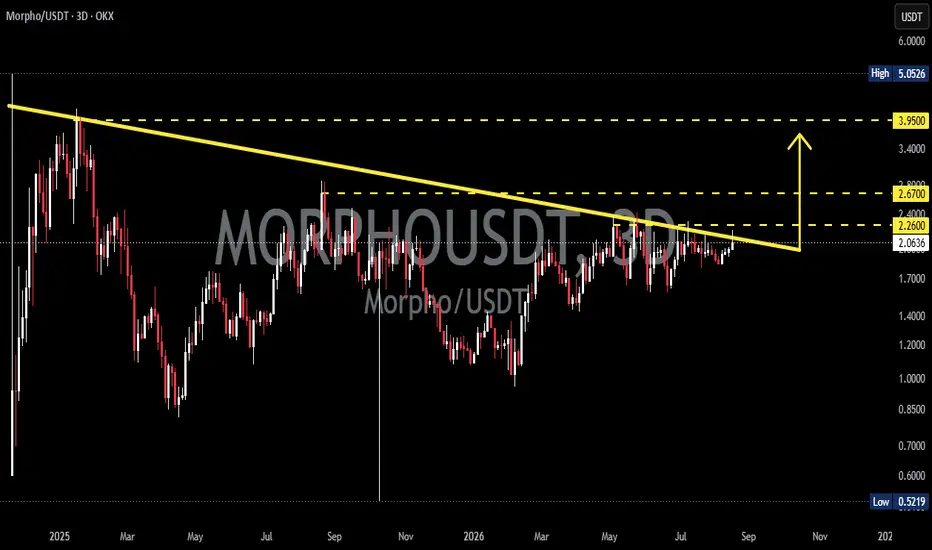
📊 Technical Analysis
💵 Coin: MORPHO / USDT
⌛ Time Frame: 3D
📉 Pattern: Long-Term Descending Trendline / Compression
💰 Current Area: ~$2.05
🎯 Key Resistance: $2.26 – $2.67
🔥 Major Target: $3.95
📈 Major High: ~$5.05
---
📉 Pattern & Market Structure
MORPHO is currently approaching a major long-term Descending Trendline that has been controlling the broader bearish structure since the previous major highs.
🔸 This descending trendline has repeatedly acted as dynamic resistance, preventing price from establishing a sustained bullish expansion.
🔸 At the same time, recent price action showsMORPHO consolidating around the $1.70 – $2.10 region, while gradually pressing against the descending resistance.
🔸 This creates an important price compression structure. As price continues to test the trendline, a decisive breakout could potentially trigger a significant expansion in volatility.
⚠️ However, the breakout has not yet been clearly confirmed. The trendline remains the primary technical barrier that bulls need to overcome.
---
🟢 Bullish Scenario
The bullish scenario becomes significantly stronger ifMORPHO manages to produce a convincing 3D candle close above the descending trendline.
🚀 A confirmed breakout could indicate that the long-term bearish pressure is beginning to weaken.
🎯 The first important resistance is located around $2.26.
📈 If $2.26 is reclaimed and successfully converted into support, the next major resistance sits around $2.67.
🔥 A clean breakout above $2.67 could open the way toward the larger $3.95 resistance/target zone shown on the chart.
💥 Reaching $3.95 would represent a substantial recovery from the current ~$2.05 area and would confirm a much stronger change in the medium-to-long-term market structure.
---
🔴 Bearish Scenario
The descending trendline is still active resistance until proven otherwise.
📉 IfMORPHO gets rejected again from this trendline and fails to reclaim $2.26, sellers could regain control.
⚠️ A rejection could push price back toward the recent consolidation/support region around $1.70 – $1.80.
🔻 Losing that area would weaken the current recovery structure and increase the probability of a deeper retracement toward previous lower support zones.
Therefore, traders should avoid treating a simple wick above the trendline as confirmation. A strong candle close and sustained price action above resistance would provide much better confirmation.
---
🔑 Key Levels to Watch
🟡 $2.26 → First breakout confirmation / resistance
🟡 $2.67 → Major resistance and continuation level
🟡 $3.95 → Major bullish target / resistance
🔵 $5.05 → Previous major high area
---
🧠 Conclusion
MORPHO is currently sitting at a critical technical decision point.
The long-term descending trendline remains the most important structure on this chart. Price is gradually compressing underneath it, meaning a decisive move could potentially occur once this structure is broken.
🟢 Breakout + 3D close above the trendline → bullish structure begins to strengthen.
🚀 Breakout above $2.26 → increases probability of continuation toward $2.67.
🔥 Breakout above $2.67 → could unlock a much larger move toward the $3.95 major resistance zone.
🔴 Trendline rejection → keeps the broader bearish structure intact and could send price back toward lower support.
👀 The key is confirmation. The trendline breakout could become the trigger for MORPHO's next major directional move.
#MORPHO #MORPHOUSDT #Crypto #CryptoTrading #TechnicalAnalysis #Altcoins #Altcoin #Breakout #Bullish #CryptoAnalysis #PriceAction #Trendline
💵 Coin:
MORPHO / USDT⌛ Time Frame: 3D
📉 Pattern: Long-Term Descending Trendline / Compression
💰 Current Area: ~$2.05
🎯 Key Resistance: $2.26 – $2.67
🔥 Major Target: $3.95
📈 Major High: ~$5.05
---
📉 Pattern & Market Structure
MORPHO is currently approaching a major long-term Descending Trendline that has been controlling the broader bearish structure since the previous major highs.🔸 This descending trendline has repeatedly acted as dynamic resistance, preventing price from establishing a sustained bullish expansion.
🔸 At the same time, recent price action shows
MORPHO consolidating around the $1.70 – $2.10 region, while gradually pressing against the descending resistance.🔸 This creates an important price compression structure. As price continues to test the trendline, a decisive breakout could potentially trigger a significant expansion in volatility.
⚠️ However, the breakout has not yet been clearly confirmed. The trendline remains the primary technical barrier that bulls need to overcome.
---
🟢 Bullish Scenario
The bullish scenario becomes significantly stronger if
MORPHO manages to produce a convincing 3D candle close above the descending trendline.🚀 A confirmed breakout could indicate that the long-term bearish pressure is beginning to weaken.
🎯 The first important resistance is located around $2.26.
📈 If $2.26 is reclaimed and successfully converted into support, the next major resistance sits around $2.67.
🔥 A clean breakout above $2.67 could open the way toward the larger $3.95 resistance/target zone shown on the chart.
💥 Reaching $3.95 would represent a substantial recovery from the current ~$2.05 area and would confirm a much stronger change in the medium-to-long-term market structure.
---
🔴 Bearish Scenario
The descending trendline is still active resistance until proven otherwise.
📉 If
MORPHO gets rejected again from this trendline and fails to reclaim $2.26, sellers could regain control.⚠️ A rejection could push price back toward the recent consolidation/support region around $1.70 – $1.80.
🔻 Losing that area would weaken the current recovery structure and increase the probability of a deeper retracement toward previous lower support zones.
Therefore, traders should avoid treating a simple wick above the trendline as confirmation. A strong candle close and sustained price action above resistance would provide much better confirmation.
---
🔑 Key Levels to Watch
🟡 $2.26 → First breakout confirmation / resistance
🟡 $2.67 → Major resistance and continuation level
🟡 $3.95 → Major bullish target / resistance
🔵 $5.05 → Previous major high area
---
🧠 Conclusion
MORPHO is currently sitting at a critical technical decision point.The long-term descending trendline remains the most important structure on this chart. Price is gradually compressing underneath it, meaning a decisive move could potentially occur once this structure is broken.
🟢 Breakout + 3D close above the trendline → bullish structure begins to strengthen.
🚀 Breakout above $2.26 → increases probability of continuation toward $2.67.
🔥 Breakout above $2.67 → could unlock a much larger move toward the $3.95 major resistance zone.
🔴 Trendline rejection → keeps the broader bearish structure intact and could send price back toward lower support.
👀 The key is confirmation. The trendline breakout could become the trigger for MORPHO's next major directional move.
#MORPHO #MORPHOUSDT #Crypto #CryptoTrading #TechnicalAnalysis #Altcoins #Altcoin #Breakout #Bullish #CryptoAnalysis #PriceAction #Trendline

✅ Get Free Signals! Join Our Telegram Channel Here: t.me/TheCryptoNuclear
✅ Twitter: twitter.com/crypto_nuclear
✅ Join Bybit : partner.bybit.com/b/nuclearvip
✅ Benefits : Lifetime Trading Fee Discount -50%
✅ Twitter: twitter.com/crypto_nuclear
✅ Join Bybit : partner.bybit.com/b/nuclearvip
✅ Benefits : Lifetime Trading Fee Discount -50%
免責聲明
這些資訊和出版物並非旨在提供,也不構成TradingView提供或認可的任何形式的財務、投資、交易或其他類型的建議或推薦。請閱讀使用條款以了解更多資訊。
✅ Get Free Signals! Join Our Telegram Channel Here: t.me/TheCryptoNuclear
✅ Twitter: twitter.com/crypto_nuclear
✅ Join Bybit : partner.bybit.com/b/nuclearvip
✅ Benefits : Lifetime Trading Fee Discount -50%
✅ Twitter: twitter.com/crypto_nuclear
✅ Join Bybit : partner.bybit.com/b/nuclearvip
✅ Benefits : Lifetime Trading Fee Discount -50%
免責聲明
這些資訊和出版物並非旨在提供,也不構成TradingView提供或認可的任何形式的財務、投資、交易或其他類型的建議或推薦。請閱讀使用條款以了解更多資訊。