
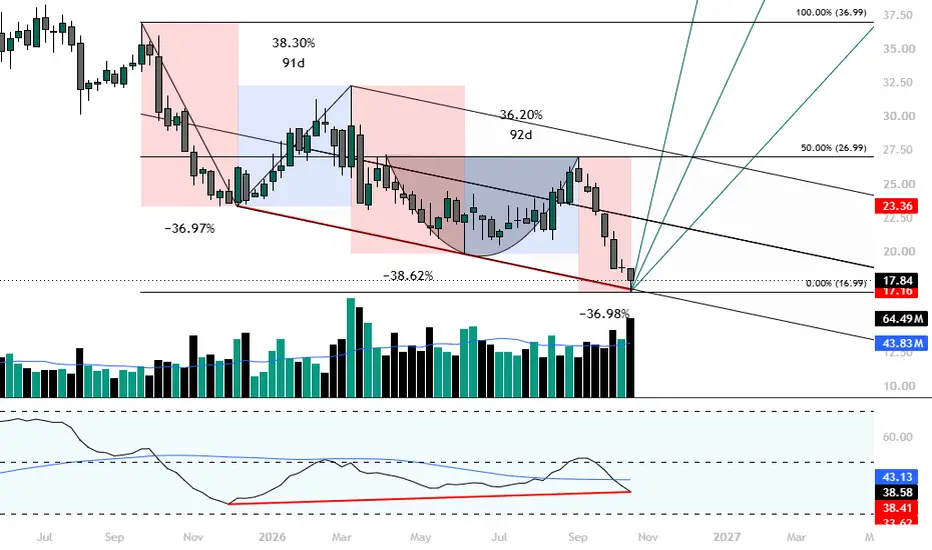
On the weekly timeframe mosaic is showing an harmonically pleasing 3 Drives. The 3 drives down are highlighted in red, the corrections in blue. WE also have a Schiff pitchfork from the top of the pattern aligning quite closely with last weeks close.
The harmonic 3 Drive pattern consists of 3 dramatic falls in price. These are intersected with 2 corrections which are usually similar or identical in price and time, as you may notice this pattern displays this almost to perfection.
The "ARC" or bowl in the centre is possibly the beginning of an Adam n Eve pattern, a type of double bottom pattern. interestingly the Arc aligns with the 50% line of the overall pattern.
For confluence I have added the volume indicator which shows us we may have had a selling climax event with way above average volume on weekly.
The RSI has been added to show a divergence between price and oscillator.
All together an overall pleasing harmonic arrangement with confluence as a bonus.
Lets see what next week brings.
The harmonic 3 Drive pattern consists of 3 dramatic falls in price. These are intersected with 2 corrections which are usually similar or identical in price and time, as you may notice this pattern displays this almost to perfection.
The "ARC" or bowl in the centre is possibly the beginning of an Adam n Eve pattern, a type of double bottom pattern. interestingly the Arc aligns with the 50% line of the overall pattern.
For confluence I have added the volume indicator which shows us we may have had a selling climax event with way above average volume on weekly.
The RSI has been added to show a divergence between price and oscillator.
All together an overall pleasing harmonic arrangement with confluence as a bonus.
Lets see what next week brings.

免責聲明
這些資訊和出版物並非旨在提供,也不構成TradingView提供或認可的任何形式的財務、投資、交易或其他類型的建議或推薦。請閱讀使用條款以了解更多資訊。
免責聲明
這些資訊和出版物並非旨在提供,也不構成TradingView提供或認可的任何形式的財務、投資、交易或其他類型的建議或推薦。請閱讀使用條款以了解更多資訊。