
Hey guys,
Yearly chart: Bullish Eng.
--> Strong Resistance at 449 and 522
--> This is the first point where some Profit taking could come.
Quarterly: Bullish - although gains are weak compared to the months before.
Monthly: Bullish Candle
--> Stochastic bearish Divergence
--> Bullish Trendline intact
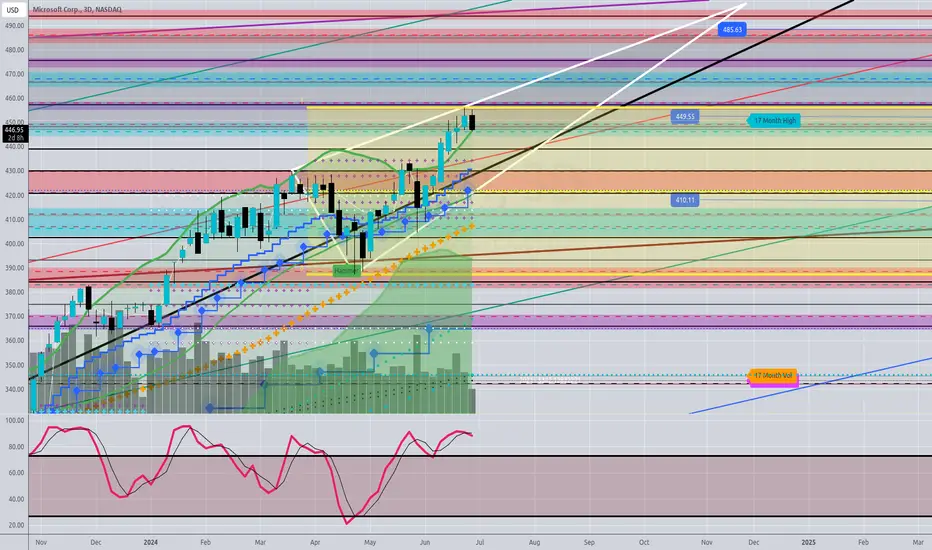
3D: Ascending Triangle Formation
--> break above would be extremely bullish because Bears are meant to take over.
Target Bulls: 485 - 582
Target bears: 410 - 388
Thanks for reading…
Yearly chart: Bullish Eng.
--> Strong Resistance at 449 and 522
--> This is the first point where some Profit taking could come.
Quarterly: Bullish - although gains are weak compared to the months before.
Monthly: Bullish Candle
--> Stochastic bearish Divergence
--> Bullish Trendline intact
3D: Ascending Triangle Formation
--> break above would be extremely bullish because Bears are meant to take over.
Target Bulls: 485 - 582
Target bears: 410 - 388
Thanks for reading…

免責聲明
這些資訊和出版物並非旨在提供,也不構成TradingView提供或認可的任何形式的財務、投資、交易或其他類型的建議或推薦。請閱讀使用條款以了解更多資訊。