
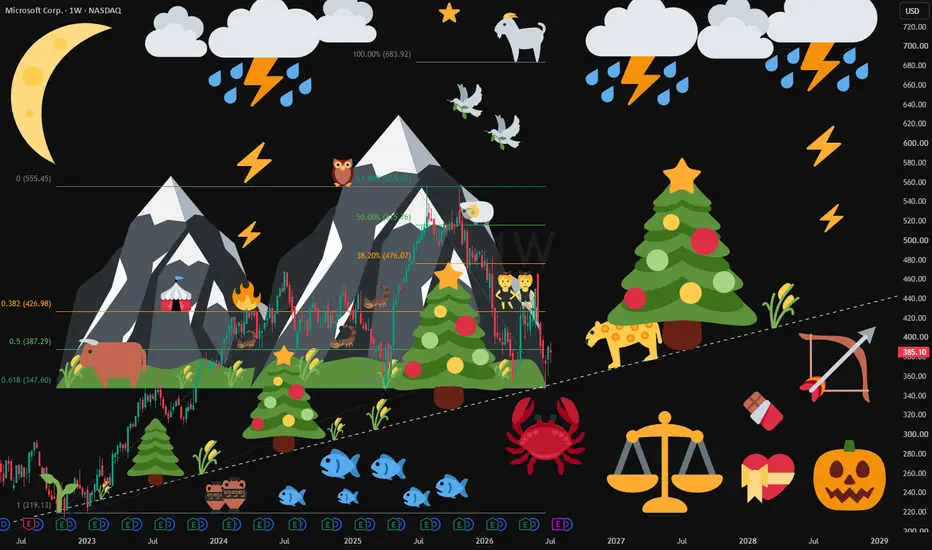
A rare structural asymmetry has been developing in the equity markets. While the S&P 500's 9.6% year-to-date return establishes a powerful macroeconomic floor, Microsoft has decoupled from the index by undergoing a -30% correction. This combination of an index momentum cycle and a discounted mega-cap growth leader presents a compelling thesis.
The broader market enters the second half of the year backed by strong cyclical momentum, where front-half strength historically serves as a launchpad:
- The S&P 500’s 9.6% YTD return crosses a historical threshold.
- Since 1990, every calendar year clearing this mid-year bar finished the S&P 500 in positive territory.
- Post-milestone, the index has historically generated an additional median gain of 9.8% over the final six months.
To maximize this expansion, capital naturally rotates toward premium growth engines. Microsoft’s retreat to the $385 range; driven by AI capital expenditure fears, presents a disconnect against its high-velocity operational metrics:
- Microsoft’s annualized AI revenue run rate has surged past $37 billion (up 123% YoY).
- The company's contracted commercial backlog stands at $627 billion, proving capex matches enterprise demand.
- This correction dragged Microsoft’s forward P/E down to 22.9x, now discounted cash flow models suggest a 45% upside within one year.
Just as front-half momentum historically breeds back-half strength for the S&P 500, a heavily compressed mega-cap leader builds the coiled-spring energy needed to fuel an index expansion. For individuals tracking this cycle, Microsoft represents a premier large-cap vehicle positioned to lead the market's second-half momentum.
The broader market enters the second half of the year backed by strong cyclical momentum, where front-half strength historically serves as a launchpad:
- The S&P 500’s 9.6% YTD return crosses a historical threshold.
- Since 1990, every calendar year clearing this mid-year bar finished the S&P 500 in positive territory.
- Post-milestone, the index has historically generated an additional median gain of 9.8% over the final six months.
To maximize this expansion, capital naturally rotates toward premium growth engines. Microsoft’s retreat to the $385 range; driven by AI capital expenditure fears, presents a disconnect against its high-velocity operational metrics:
- Microsoft’s annualized AI revenue run rate has surged past $37 billion (up 123% YoY).
- The company's contracted commercial backlog stands at $627 billion, proving capex matches enterprise demand.
- This correction dragged Microsoft’s forward P/E down to 22.9x, now discounted cash flow models suggest a 45% upside within one year.
Just as front-half momentum historically breeds back-half strength for the S&P 500, a heavily compressed mega-cap leader builds the coiled-spring energy needed to fuel an index expansion. For individuals tracking this cycle, Microsoft represents a premier large-cap vehicle positioned to lead the market's second-half momentum.

免責聲明
這些資訊和出版物並非旨在提供,也不構成TradingView提供或認可的任何形式的財務、投資、交易或其他類型的建議或推薦。請閱讀使用條款以了解更多資訊。
免責聲明
這些資訊和出版物並非旨在提供,也不構成TradingView提供或認可的任何形式的財務、投資、交易或其他類型的建議或推薦。請閱讀使用條款以了解更多資訊。