
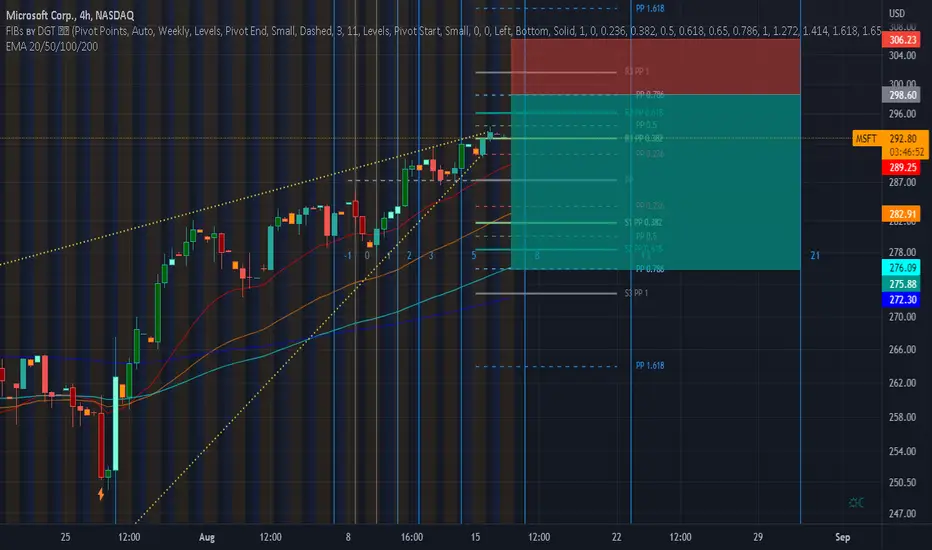
Much to the surprise of many investors, this month has seen stocks continuing to rally. A bullish rally can be identified using swing high and low underlying price points since the start of July. The golden dotted line presents this, indicating upward underlying price movements. During this period MSFT saw lows of $243 and highs of $293.
Currently trading above 20, 50, 100 and 200 day ranged EMA levels, the underlying valuation of the stock is suggested to be overvalued given that it’s trading above these averages. When trading above all EMA levels, investors should anticipate a correction, back in line with these moving averages.
When using a 1-week ranged Fibonacci investors can see that the stock is currently trading in line with its weaker 0.382 resistance level: a price of $293. Based on bullish momentum, we anticipate this resistance level to strengthen. We anticipate the stock to reach it’s stronger 0.786 resistance level: a price of $298. The investor should look to buy around this price. Once the underlying price of the stock reaches this point, it is reasonable to anticipate a correction towards its support.
Therefore, we have set a sell price in line with the 100-day ranged EMA and stronger 0.786 Fibonacci support level. The buyer should sell at $275.
Currently trading above 20, 50, 100 and 200 day ranged EMA levels, the underlying valuation of the stock is suggested to be overvalued given that it’s trading above these averages. When trading above all EMA levels, investors should anticipate a correction, back in line with these moving averages.
When using a 1-week ranged Fibonacci investors can see that the stock is currently trading in line with its weaker 0.382 resistance level: a price of $293. Based on bullish momentum, we anticipate this resistance level to strengthen. We anticipate the stock to reach it’s stronger 0.786 resistance level: a price of $298. The investor should look to buy around this price. Once the underlying price of the stock reaches this point, it is reasonable to anticipate a correction towards its support.
Therefore, we have set a sell price in line with the 100-day ranged EMA and stronger 0.786 Fibonacci support level. The buyer should sell at $275.

💥 Free signals and ideas ➡ t.me/vfinvestment
免責聲明
這些資訊和出版物並非旨在提供,也不構成TradingView提供或認可的任何形式的財務、投資、交易或其他類型的建議或推薦。請閱讀使用條款以了解更多資訊。
💥 Free signals and ideas ➡ t.me/vfinvestment
免責聲明
這些資訊和出版物並非旨在提供,也不構成TradingView提供或認可的任何形式的財務、投資、交易或其他類型的建議或推薦。請閱讀使用條款以了解更多資訊。