Hi Friends,
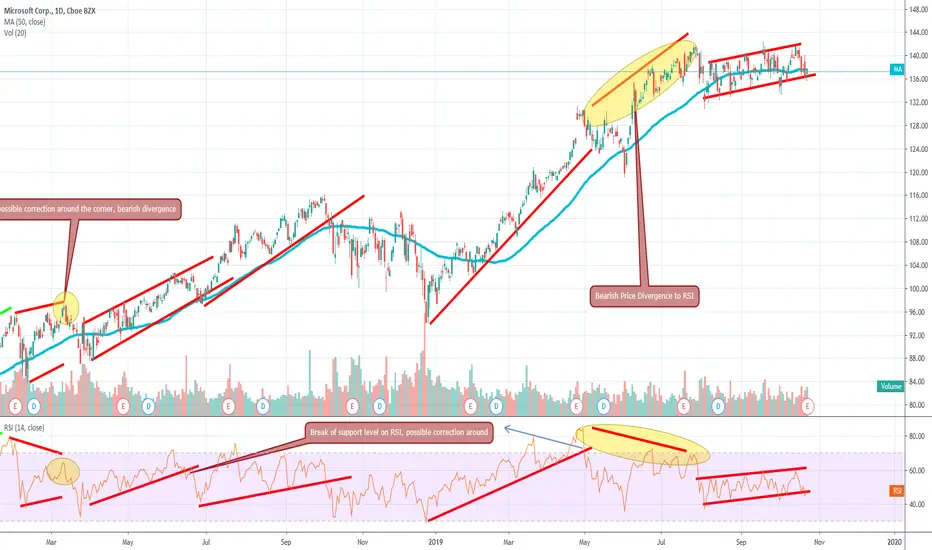
Look at this chart for MSFT. Interesting to see how breaks on supports on RSI and identifying divergences may allow to identify possible good exits and maybe a avoid big falls.
When you see divergences, go down to lower time frames to identify exits/ entry levels
Chart is self explanatory. At this moment, price has moved into a rectangle formation. Look for breakouts and be careful on both the RSI as well as price points.
Happy to answer any specifics
If you like what you see, please share a thumbs up. Happy to hear your comments too, they can be helpful to continue learning and keep posting these free ideas and analysis.
Cheers
Look at this chart for
MSFT. Interesting to see how breaks on supports on RSI and identifying divergences may allow to identify possible good exits and maybe a avoid big falls.When you see divergences, go down to lower time frames to identify exits/ entry levels
Chart is self explanatory. At this moment, price has moved into a rectangle formation. Look for breakouts and be careful on both the RSI as well as price points.
Happy to answer any specifics
If you like what you see, please share a thumbs up. Happy to hear your comments too, they can be helpful to continue learning and keep posting these free ideas and analysis.
Cheers
註釋
MSFT has broken the upwards channel, while we still don't have the candle close yet, but stock has opened on a gap today. Note, MSFT has been on an uptrend and recently MSFT bagging the Pentagon order, coupled with analyst upwards targets are positives for the stock. We need to see a few things1. How the candle closes today
2. Does the gap get filled over the next few trading sessions or does this establish itself as a another important support level going ahead
註釋

If you love what you see, pls share a thumbs up and a comment in the section below
免責聲明
這些資訊和出版物並非旨在提供,也不構成TradingView提供或認可的任何形式的財務、投資、交易或其他類型的建議或推薦。請閱讀使用條款以了解更多資訊。
If you love what you see, pls share a thumbs up and a comment in the section below
免責聲明
這些資訊和出版物並非旨在提供,也不構成TradingView提供或認可的任何形式的財務、投資、交易或其他類型的建議或推薦。請閱讀使用條款以了解更多資訊。