
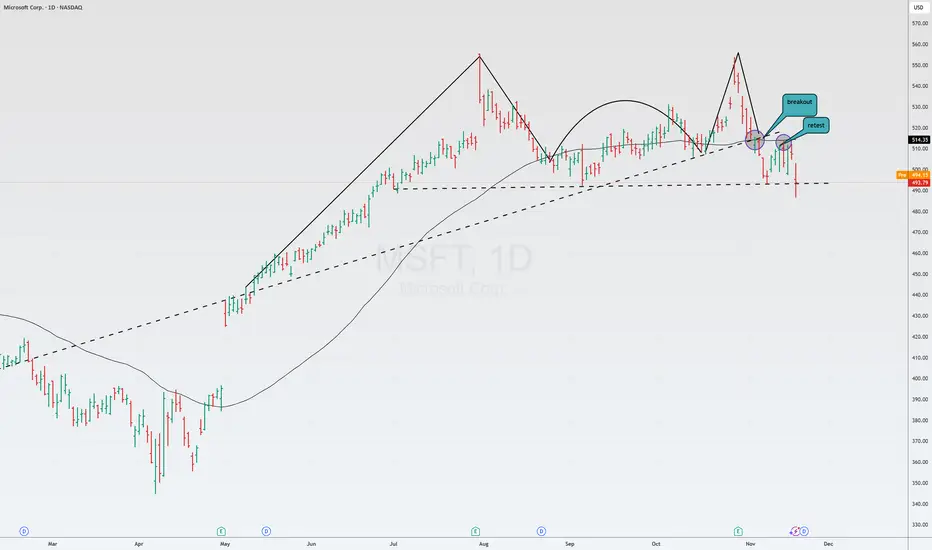
Microsoft is currently playing out a beautiful Batman pattern: having broken through the sloping trendline, retested, and also retested at 50 SMA.
However, yesterday, the market pulled the stock above the support level of 490-493, and traders may attempt a rebound after seeing a false breakout.
At the very least, going long in such a situation is very dangerous.
However, yesterday, the market pulled the stock above the support level of 490-493, and traders may attempt a rebound after seeing a false breakout.
At the very least, going long in such a situation is very dangerous.
交易結束:目標達成
In mid-November last year, we highlighted a developing technical pattern for $MSFT. Today, the shares are down over 10%, and there is reason to believe the decline will persist, and the market will at least test the $400The current sell-off is driven by the following factors:
Slowing Azure Growth: Growth in the cloud division has decelerated to 33–34% (adjusted). The market had anticipated a sharper acceleration fueled by the AI boom.
Surging Capex: Capital expenditures jumped 66% YoY, reaching $19 billion for the quarter (with $3.9 billion in financial leases)
OpenAI Concentration Risk: For the first time, it was revealed that OpenAI accounts for a significant portion of Microsoft's revenue momentum. Such high reliance on a single partner is perceived as a structural risk.
Soft Margin Guidance: The company’s operating margin guidance for the upcoming quarter (approx. 45.1%) fell short of analyst expectations.

免責聲明
這些資訊和出版物並非旨在提供,也不構成TradingView提供或認可的任何形式的財務、投資、交易或其他類型的建議或推薦。請閱讀使用條款以了解更多資訊。
免責聲明
這些資訊和出版物並非旨在提供,也不構成TradingView提供或認可的任何形式的財務、投資、交易或其他類型的建議或推薦。請閱讀使用條款以了解更多資訊。